My exploration through the world of management accounting led me towards learning more about these 2 formats of the P&L statement.
Speaking with a few consulting Management Accountants, it became clear that the 'default' chart of accounts used in most companies doesn't always capture the story behind the figures for a particular business.
However, a slightly modified Chart of Accounts usually does, so the question for me was more like how to edit the Chart of Accounts easily and compute the P&L.
ProudNumbers contain Chart of Accounts Editor, and I remember very well that coffee shop meeting in Torrington, where the idea was born and later implemented into our product around 2017.
Recently I discovered that most of the US-based airline companies are using P&L (Income statement) based by nature, and that is our subject in this article.
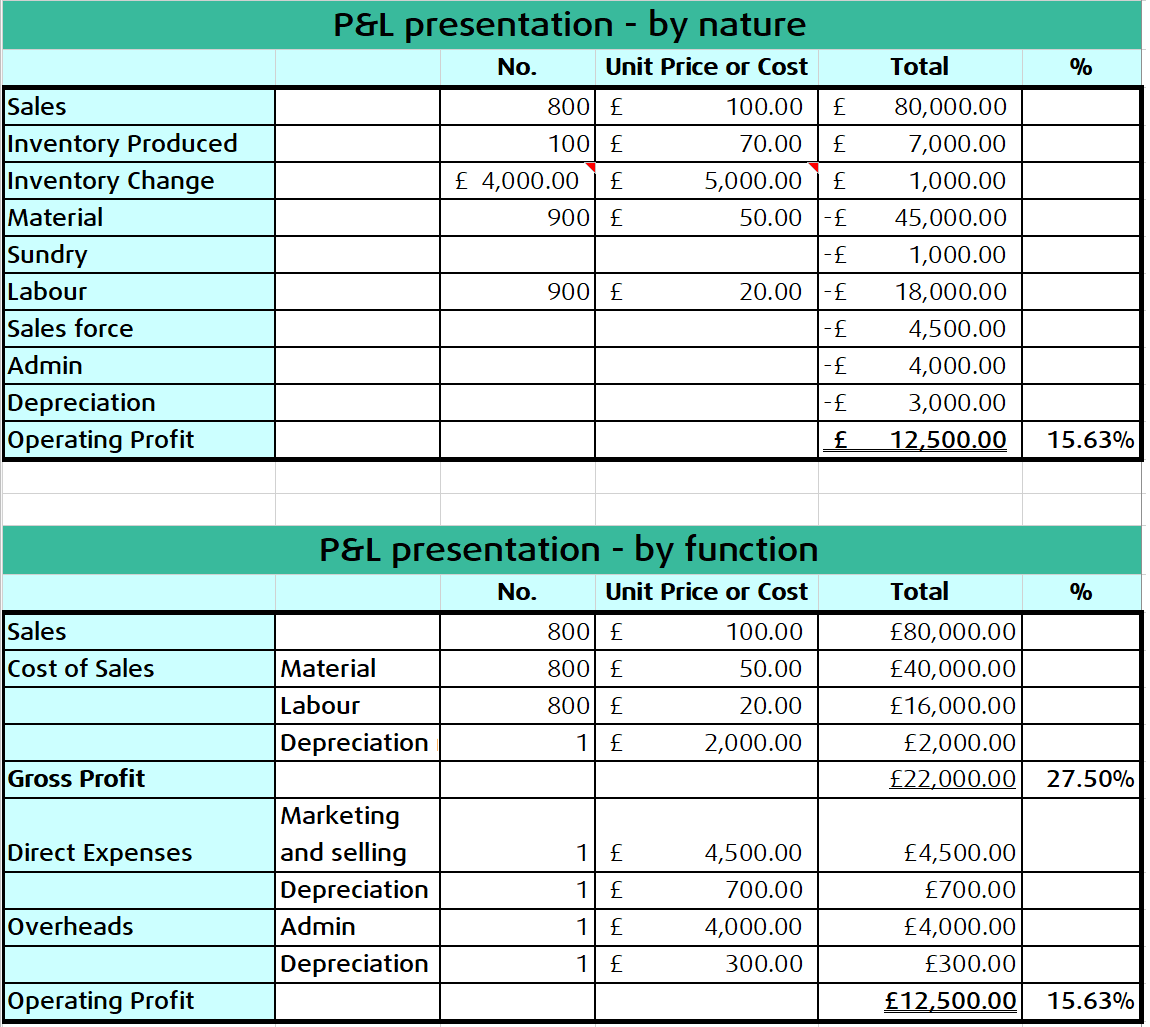
Both formats yield the same result in terms of Net profit before taxation. However, the P&L by nature shows the changes in inventories of finished goods, and in work in progress. This is expressed as a difference between Closed and Opening Inventory values.
The P&L by Nature can be described as
- Sales
- Changes in inventories of finished goods, and work in progress
- Material purchases
- Labour cost
Marketing expenses
Depreciation on equipment, and all other activities
Saying that, we immediately see that the changes in inventories are giving us an idea about finances required to produce the stock.
The by-nature format is simple to apply, as no allocation of expenses is required. This format offers a more detailed breakdown of the costs.
The P&L by function is that classic annotation, as we all know it and use it
- Sales
- Cost of Goods Sold
- Direct Expenses
- Overheads.
In terms of depreciation, it is allocated to respective categories. It also shows the Gross-Profit figure, which allows easier benchmarking within industry.
As the depreciation is not shown directly, the understanding of elements needs to be built from the Cash flow statement.
I went through the exercise in the [1]. The example was familiar, as once we worked on software to administer production of beer barrels.
The factory sold 800 barrels out of 900 it produced. Each barrel sells for £100.
The material for each barrel costs £50, and the cost of labour is £20.
The sales force costs £4,500 per year, and the outsourced admin £4,000.
The depreciation for the year is £3,000.
- £2000 for tools and machinery,
- £700 for the sales office
- £300 for the admin.
The cost of material was £46,000, and the opening inventory was counted £4,000, and the closing inventory was £5,000.
I have produced both variants enclosed and checked against the literature.
Would you consider this form of P&L presentation useful for your SME?