One of the less known analyses is to look at your Cost of Sales, Direct Expenses, and Overheads, as percentages of Total Sales.
We all are accustomed to the Gross Profit, and Net Profit, so we can apply the same formula for the other elements contributing to the Net-Profit result percentage.
I've done that in my example, and over the years, I've been doing this analysis for my costs of software tools, server rental, and other production means.
Similarly, one needs to know the percentages of overheads, such as office rent, power, and light, and motor account expenses.
The attached image sums it up, as it shows a hypothetical forecourt, selling petrol, and diesel, together with a few other products.
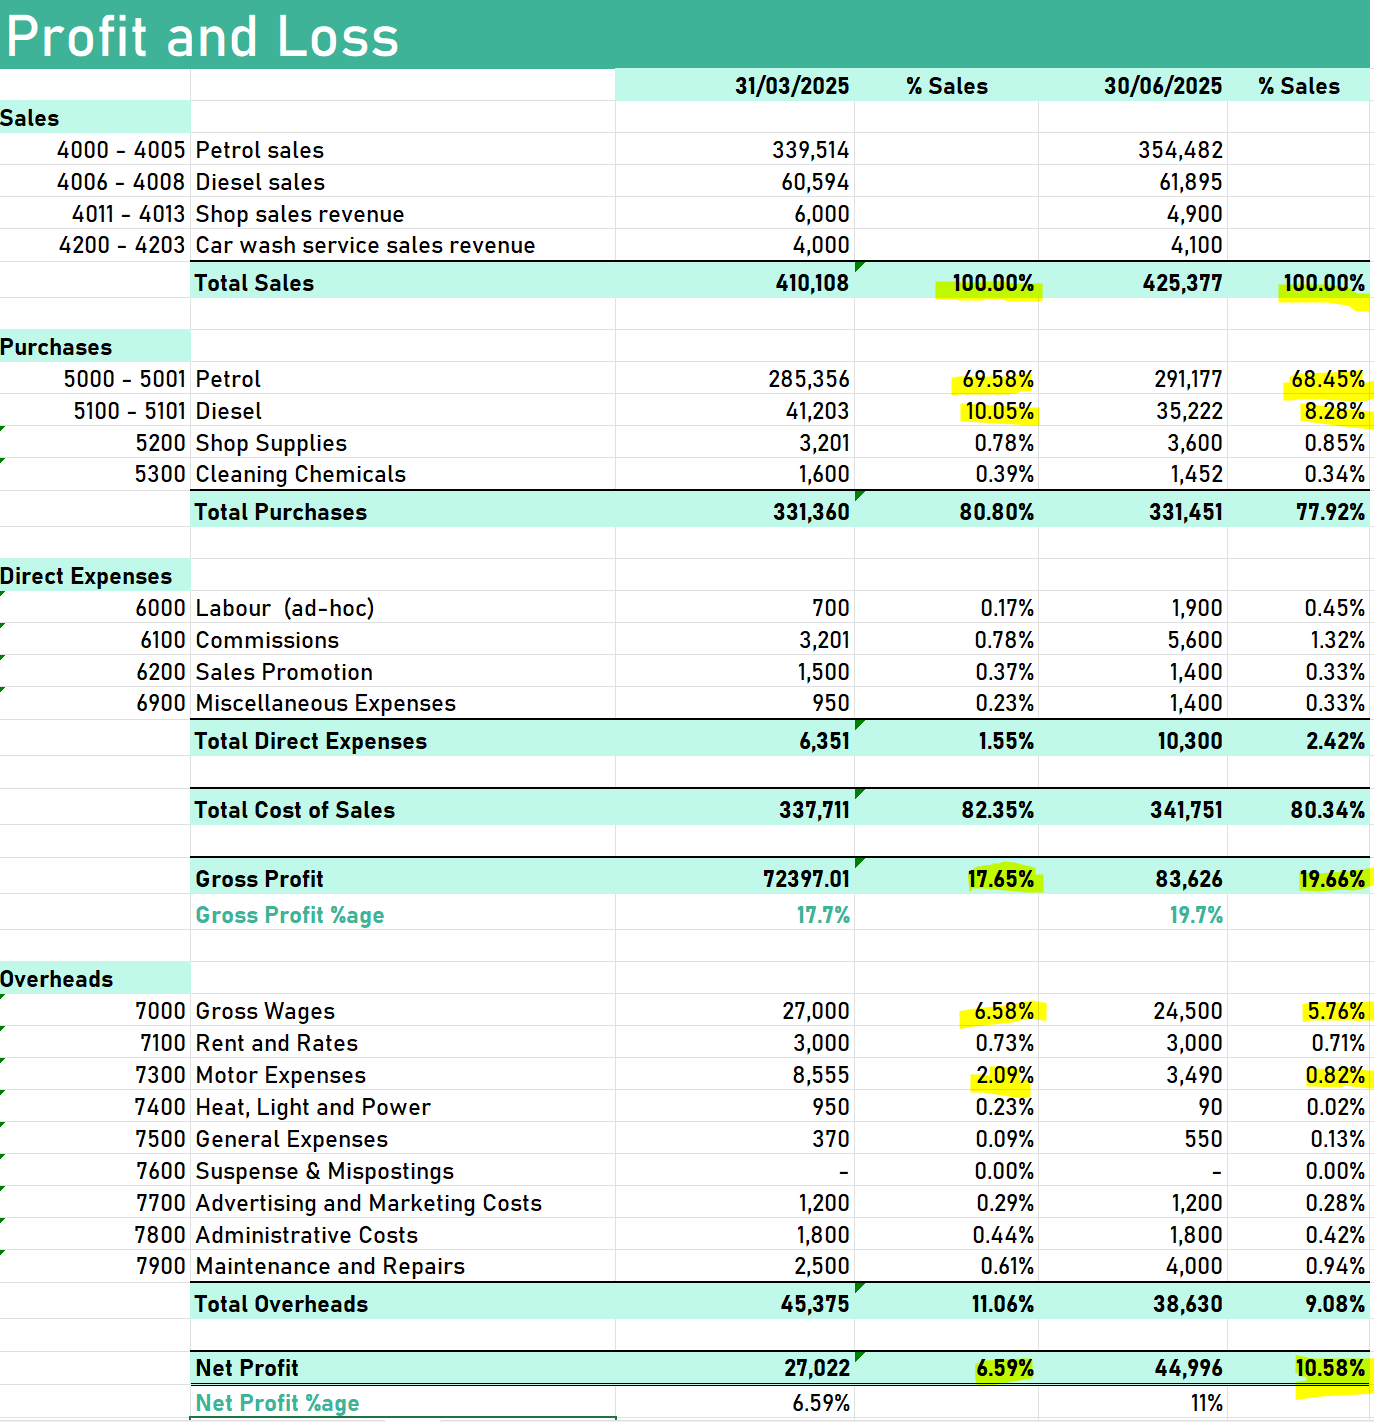
Knowing how the costs are fluctuating as a percentage of total sales gives you a "yardstick" measure - quoting [1].
To emphasise, we need to do this analysis in the time series—the example compares 2 quarters where as you can see, the gross profit margin increased 2 % from quarter to quarter, thanks to lower purchasing price of petrol, and diesel.
Also, the hypothetical company was able to save 0.9% on Gross Wages and save significantly on the cost of vehicles—(Motor Expenses) about 1.2%.
So all that "tailwind" helped to improve Net Profit by about 4%.
It is a hypothetical example, but as business owners we need to get accustomed to this way of analysing and knowing our economic performance. This is more than required in our current economic and political environment—simply knowing the past performance and estimate the future performance.
What I see as a customer of local businesses - servicing my car, speaking with electricians, or just walking around the industrial estates - the owners had to trim the staff headcount.
Even looking at my example, you can get that feel that increased overheads, with the same or lower sales just don't marry very well.
ProudNumbers can help the larger businesses, as each figure on the P&L in the program is drillable into underlying transactions, so the users can instantly see why some cost figure is unexpectedly high. The same functionality is available in the Sales part of the P&L.
Once that yardstick analysis is in place, the platform for improvement has been established supported by good practice.