Open Profit and Loss account analysis
One of the less known analyses is to look at your Cost of Sales, Direct Expenses, and Overheads, as percentages of Total Sales.
We all are accustomed to the Gross Profit, and Net Profit, so we can apply the same formula for the other elements contributing to the Net-Profit result percentage.
I've done that in my example, and over the years, I've been doing this analysis for my costs of software tools, server rental, and other production means.
Similarly, one needs to know the percentages of overheads, such as office rent, power, and light, and motor account expenses.
The attached image sums it up, as it shows a hypothetical forecourt, selling petrol, and diesel, together with a few other products.
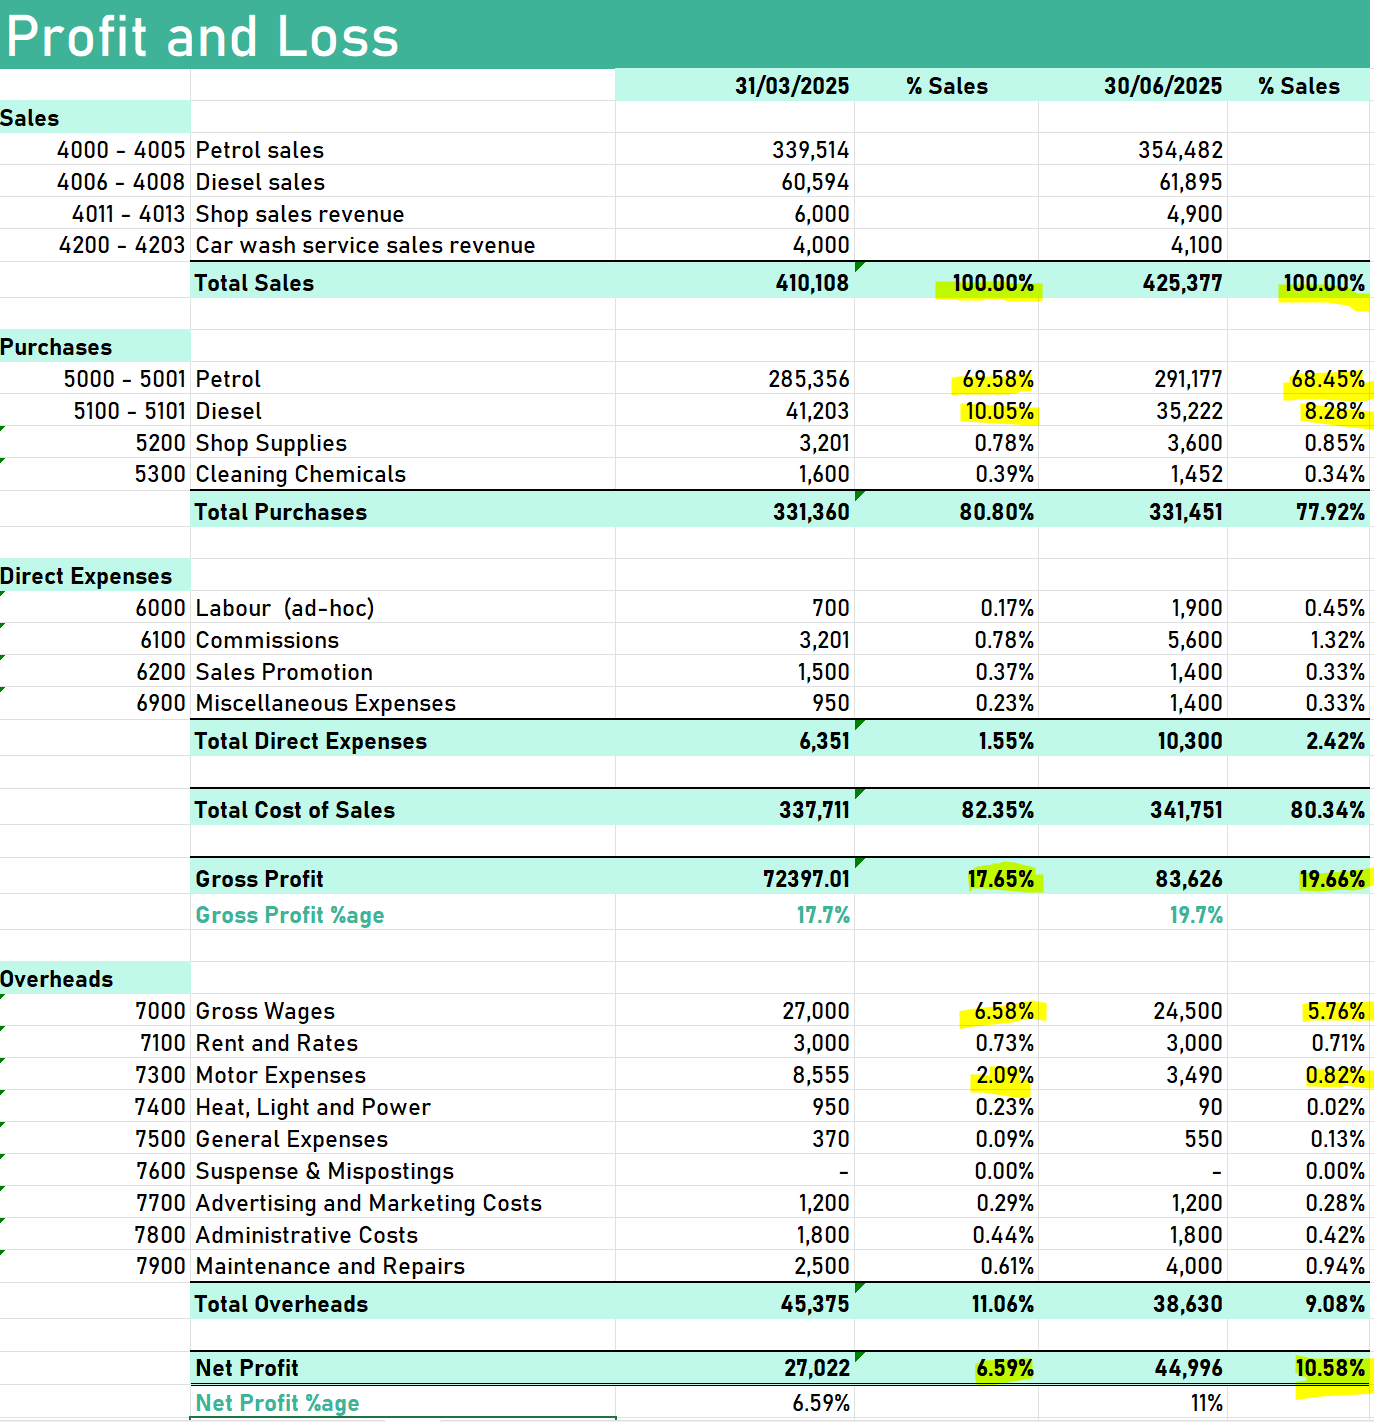
Knowing how the costs are fluctuating as a percentage of total sales gives you a "yardstick" measure - quoting [1].
To emphasise, we need to do this analysis in the time series—the example compares 2 quarters