---
title: "ABC of Management Accounting"
author: "Pavol Rovensky & Nick Sainsbury, ACA"
url: "https://abc.hexner.app/2/abc-of-management-accounting"
---
##Touch the pulse of the business by looking at its past performance and current trends.
**Every. business owner is faced with a periodic compliance obligation and submitting their Company Accounts to HMRC, and the Companies House.**
The documents required to comply with the obligations can be classified as a result of a process called “Financial Accounting”.
Looking at the financial performance of any business from the perspective of a manager, the term “Management Accounting” is introduced.
For the sake of brevity, we will not go deep into managerial function, but I always quote the late Peter Ashton, a local Chairman of the Federation of Small Businesses in the Bideford branch, who told me at the time:
_"It is rather challenging to plan for the next year or even a quarter taking into account the missing stability."_
Having said that, we clearly see that in an unstable environment, we just cannot afford to fly blind, and **we need to touch on the pulse of the business by looking at its past performance, and current trend**.
What are then the main differences between the financial and management accounting?
The Management Accounts cover the needs of managers, and their users are internal.
For financial accounting - they are governed by Company Law and used by external parties.
The time period can be different, as for Management Accounts we need to generate them monthly, or quarterly, when looking back on the past performance.
More seasonal businesses may require different reporting periods to compare between seasons.
Also, the structure of the business must be reflected in the management accounts, e.g. divisional or departmental structure, if these units need to report separately.
That requirement doesn’t exit for financial accounting, as the company usually doesn’t need to report on its internal organisational units.
The following qualities need to be emphasised—speed vs. accuracy.
As our users say, Management Accounts are as good as they are valid—now! Not tomorrow, not yesterday.
So we need to be able to compile them quickly. Compared to financial accounting where the accuracy is the key.
All of us went through a lot of pain when we cannot something reconcile, or a transaction needs to be entered into a suspense account, because we simply are missing information from
another system.
All of that can happen, but that is where the speed of generating Management Accounts is important, and the accuracy comes later - obviously acknowledging the issues.
Summarising my thoughts, here is a nutshell version about financial vs. management accounting.
1. Governed by Company Law vs. Needs of managers.
2. Fulfilling the needs of External Users vs. the Needs of Internal Staff.
3. The time period for management accounting is flexible and reflects the needs of the business.
4. The internal organisation structure must be reflected in the Management Accounts.
5. Trade speeds against accuracy, as the Management Accounts are only valid when they have been compiled.
**For the most up-to-date chapter explaining the problem "[Why Do We Have Management Accounts?" please read this chapter]( https://abc.hexner.app/2/abc-of-management-accounting/42/why-do-we-have-management-accounts) from our guest writer Rob Newman, Managing Partner of the accounting firm Carter, Collins & Myer in the guest section.**
As a software developer, most of the literature I've come across over the years, deals with accounting equations, and definitions of assets, liabilities and equity, in its fundamental form. The world of accounting revolves around these entities.
However, there are Fundamental Accounting Concepts, which are not so well explained.
The book [1], which I believe is a seminal work addressed for the needs of SME owners, and directors, brings a lot of clarity and explained these concepts in detail.
Preparing this article, I can spot that the wording of the concepts and explanations have changed, I've found that the normative text started as SSAP2, through FRS18, and FRS102.
I've heard the principles over the years, in personal communications with our company accountants, and also in the consulting sessions, which we attended over the years while working on ProudNumbers.
As the author of the book states very poignantly on pg. 26, we become a nation driven by the profit and loss account. The up-to-date explanation, which became famous in the world of alternative media news, talks about a profit-based economy vs. purpose-based economy [2].
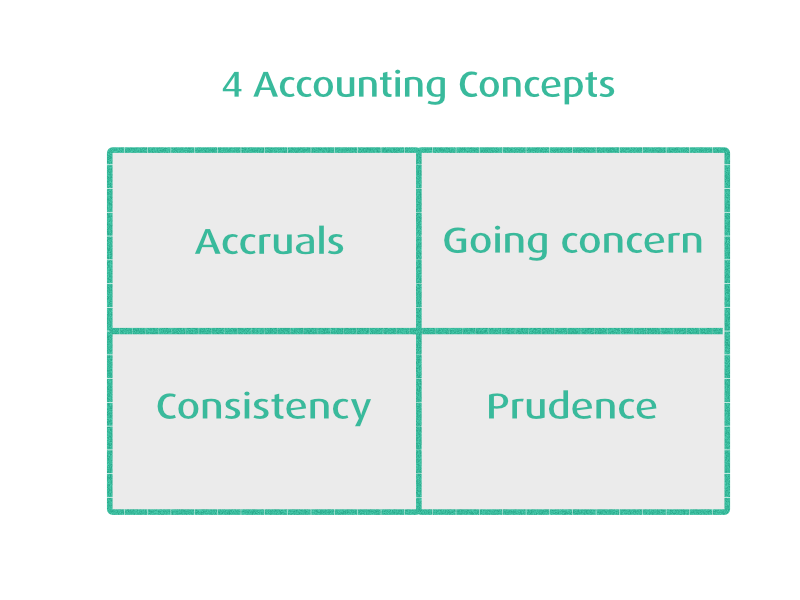
Let us then look at these fundamental principles:
✅ Accruals (or matching) concept
This is to say that the accounts contain income and expenditure on an arising basis. The term accounting period is introduced here - mostly a month of the year - and we are looking at the fact whether the item has been consumed by the business or sold in that month.
It is most likely that the item sale price has not been received, similarly the cost of item consumption can be paid later.
So we do not produce accounts based on the cash, which has or has not been received.
The collection of cash is critical, and we can see that following the accruals’ concept, we measure the profit and loss account, however, the collection of money could happen much later. This is a key learning from this, and as business owners we need to be aware about the principal nature of this concept used.
✅ Going concern concept
When the accounts are being prepared, it is assumed that the company will continue trading into the future. The going concern assumption must be included, as otherwise it could be very complicated to show the truthful value of assets, for example, plant and machinery.
✅ Consistency concept
This is a relatively simple, self-defining concept. Accounting policies should remain consistent from year to year. As the author mentioned in his book, consistency is a concept easy to explain but hard to enforce.
✅ Prudence concept
Does conservative billing term mean the same thing as prudency? The profits should not be overstated. Combined with consistency, it makes complete sense.
But, looking at past big scandals, I think that companies do not always follow this principle in detail.
---
References:
[1] Mastering Financial Management, Brookson S., 1998, London
[2] Podcast program, Berletic, B., New Atlas, 2024-2025
The Profit&Loss statement is a financial report which differentiates 4 main categories to aggregate financial information and getting Gross-Profit, and Net-Profit figures.
This classification is generally well known to SME business owners, and expressing it in relative percentages allows us to compare between different industries.
To understand Profit and Loss, we define the 4 categories and derive the Gross-Profit and Net-Profit figures.
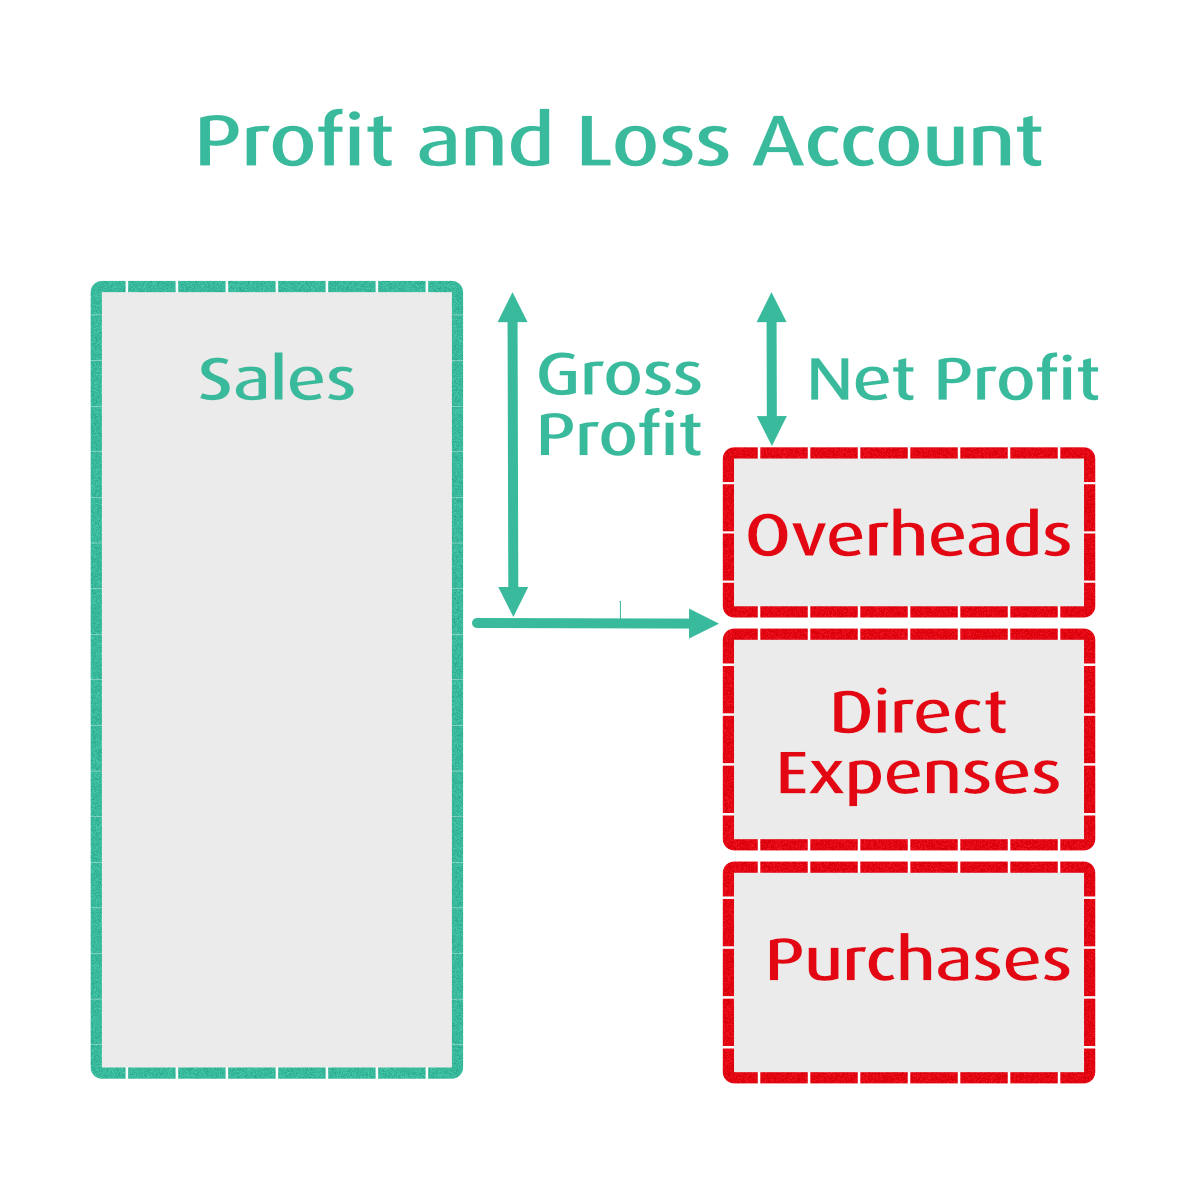
Sales are the easiest part, as it describes the overall volume of activity. It doesn't include VAT.
As the goods for sales need to be purchased or produced from raw materials, the P&L report contains 2 headings - Purchases of the goods, and Labour needed to be provided to create the product.
Gross Profit is defined as
GP = Sales - Purchases - Direct Expenses
The Gross Profit will provide the raw effectiveness of the 'factory'. The computation itself is straight forward, but as software developers we need to be aware, that Sales are recorded as credits - thus with a negative sign in the database systems representing the number.
However, for presentation purposes, to make it easier for users, we need to flip the sign.
The same step but with an opposite sign is introduced for Purchases and Direct Expenses.
As the business needs to account for things like office costs,heat, light and power, the concept of Other costs, or Overheads is introduced.
The distinction, which costs should be treated as Overheads, and where the Direct Expenses could be a question for your management accountant.
For a software business, the software product is intrinsically connected with its marketing, so using the Marketing cost as a Direct Expense is most likely a necessity to keep the contributing factor in the Gross Profit.
For many small businesses, it can be an option to look at Overheads, as a relatively tiny portion, and account almost with a fixed number throughout the year. Some nation's taxation systems allow such fixed overheads.
As we are purely staying with the Management Accounts, I'm suggesting some ways to simplify the implementation of the concepts but stay with the general principles.
The Net Profit is defined as
NP = GP - Overheads = Sales - Purchases - Direct Expenses
As we touched on the concept of 2 operating cycles, we see a problem emerging.
Most SMEs perform the continuous interlacing of the Investing and Operating cycles, which could give some headache to decipher the issues.
Add to it the IP valuation uncertainty, and we are immediately seeing that a good bookkeeping system is a necessity and so could be a responsible bookkeeper.
That forces us to define the Nominal Codes in the Nominal Ledger - the transaction identification - in a granularity the business requires.
Each additional complexity brings cost, and needs a careful consideration of what to differentiate.
My exploration through the world of management accounting led me towards learning more about these 2 formats of the P&L statement.
Speaking with a few consulting Management Accountants, it became clear that the 'default' chart of accounts used in most companies doesn't always capture the story behind the figures for a particular business.
However, a slightly modified Chart of Accounts usually does, so the question for me was more like how to edit the Chart of Accounts easily and compute the P&L.
ProudNumbers contain Chart of Accounts Editor, and I remember very well that coffee shop meeting in Torrington, where the idea was born and later implemented into our product around 2017.
Recently I discovered that most of the US-based airline companies are using P&L (Income statement) based by nature, and that is our subject in this article.
Both formats yield the same result in terms of Net profit before taxation. However, the P&L by nature shows the changes in inventories of finished goods, and in work in progress. This is expressed as a difference between Closed and Opening Inventory values.
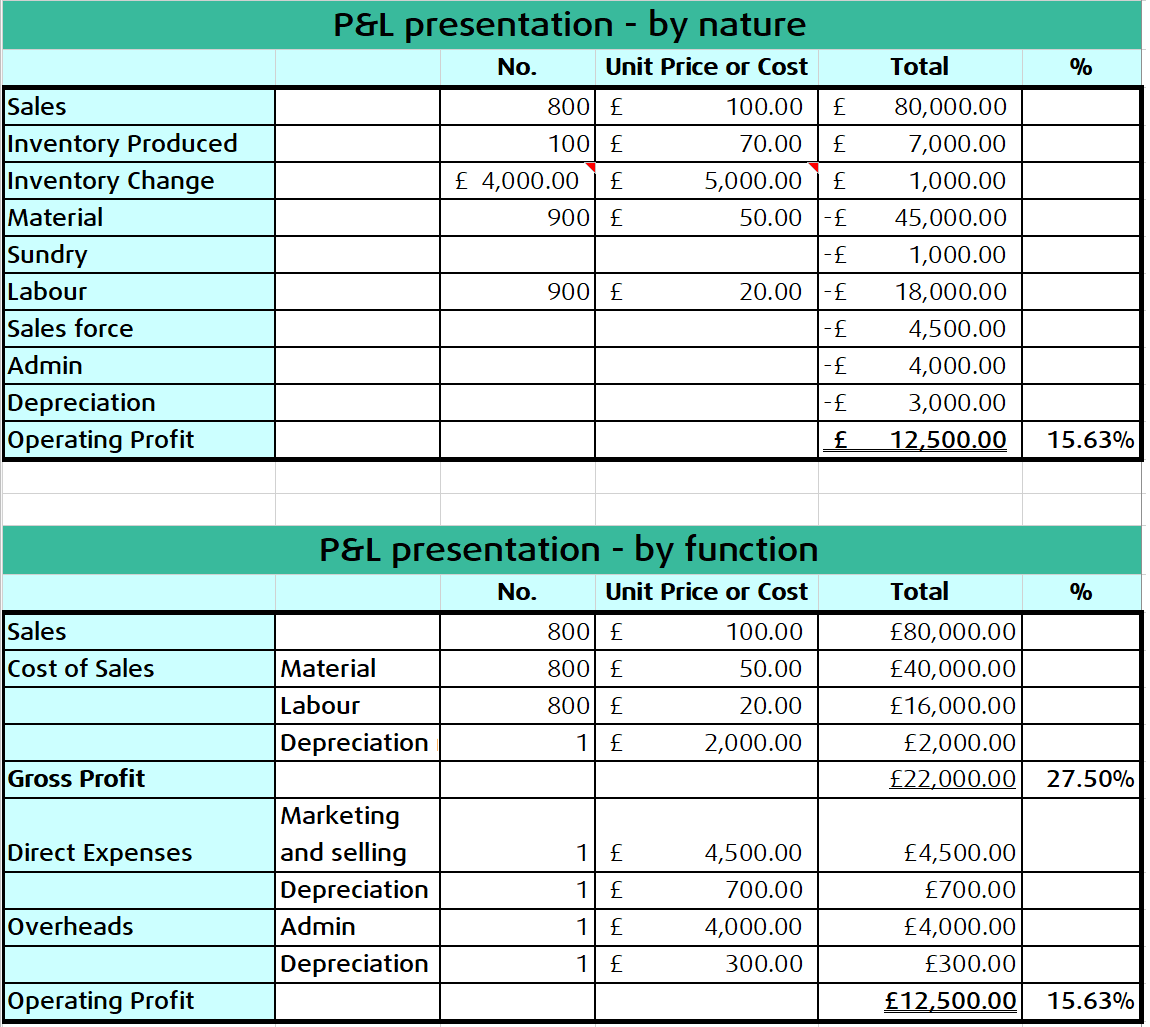
The P&L by Nature can be described as
+ Sales
+ Changes in inventories of finished goods, and work in progress
- Material purchases
- Labour cost
- Marketing expenses
- Depreciation on equipment, and all other activities
Saying that, we immediately see that the changes in inventories are giving us an idea about finances required to produce the stock.
The by-nature format is simple to apply, as no allocation of expenses is required. This format offers a more detailed breakdown of the costs.
The P&L by function is that classic annotation, as we all know it and use it
+ Sales
- Cost of Goods Sold
- Direct Expenses
- Overheads.
In terms of depreciation, it is allocated to respective categories. It also shows the Gross-Profit figure, which allows easier benchmarking within industry.
As the depreciation is not shown directly, the understanding of elements needs to be built from the Cash flow statement.
I went through the exercise in the [1]. The example was familiar, as once we worked on software to administer production of beer barrels.
The factory sold 800 barrels out of 900 it produced. Each barrel sells for £100.
The material for each barrel costs £50, and the cost of labour is £20.
The sales force costs £4,500 per year, and the outsourced admin £4,000.
The depreciation for the year is £3,000.
- £2000 for tools and machinery,
- £700 for the sales office
- £300 for the admin.
The cost of material was £46,000, and the opening inventory was counted £4,000, and the closing inventory was £5,000.
I have produced both variants enclosed and checked against the literature.
Would you consider this form of P&L presentation useful for your SME?
The key concept of the Balance sheet is a snapshot of the business assets less liabilities and items of capital.
The report as such is less understood as P&L by general business person.
Learning more about how to interpret the balance sheet is exciting. Compiling the last few posts gave me an opportunity to learn more about management accounting, as I ever could hope for.
Knowing the internals of reporting for accountants gives us - developers - an exceptional springboard into knowledge about business and how things work.
The accounting convention used is called historic cost. So the value of assets is recorded at their original historic cost. Of course, current values are different and can be recalled for items such as land.
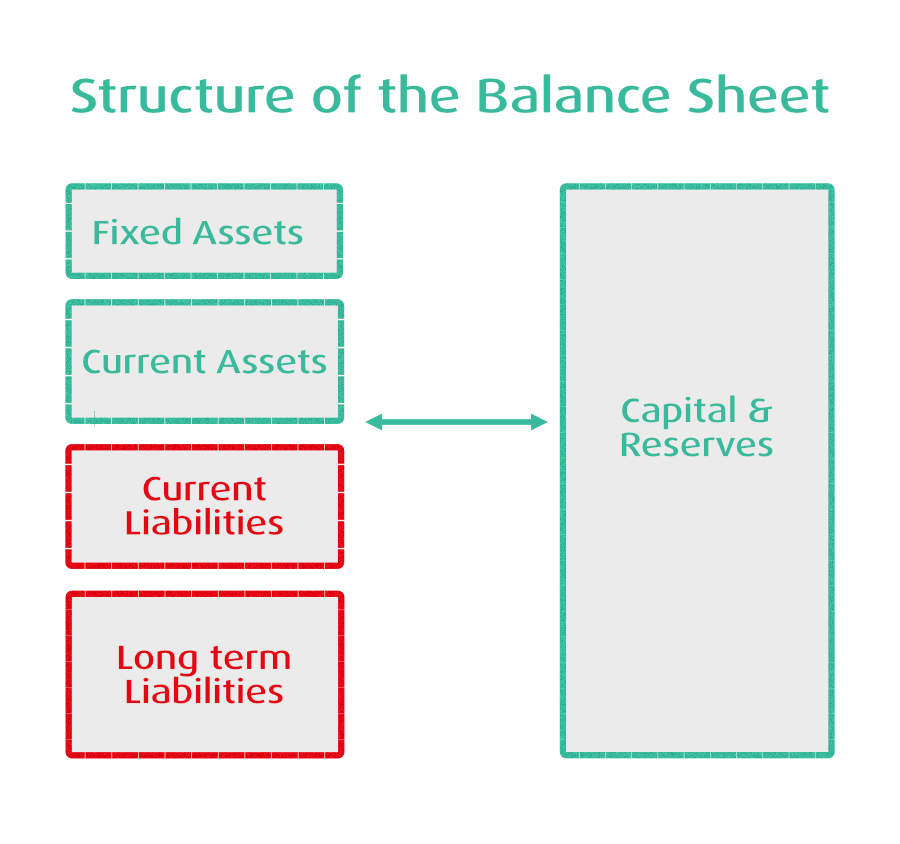
Looking at the structure of the balance sheet, we see the following headings:
- Fixed Assets
- Current Assets
- Current Liabilities
- Long-term liabilities
- Capital & Equity
Discussing the headings on the Balance Sheet we can discuss the following points:
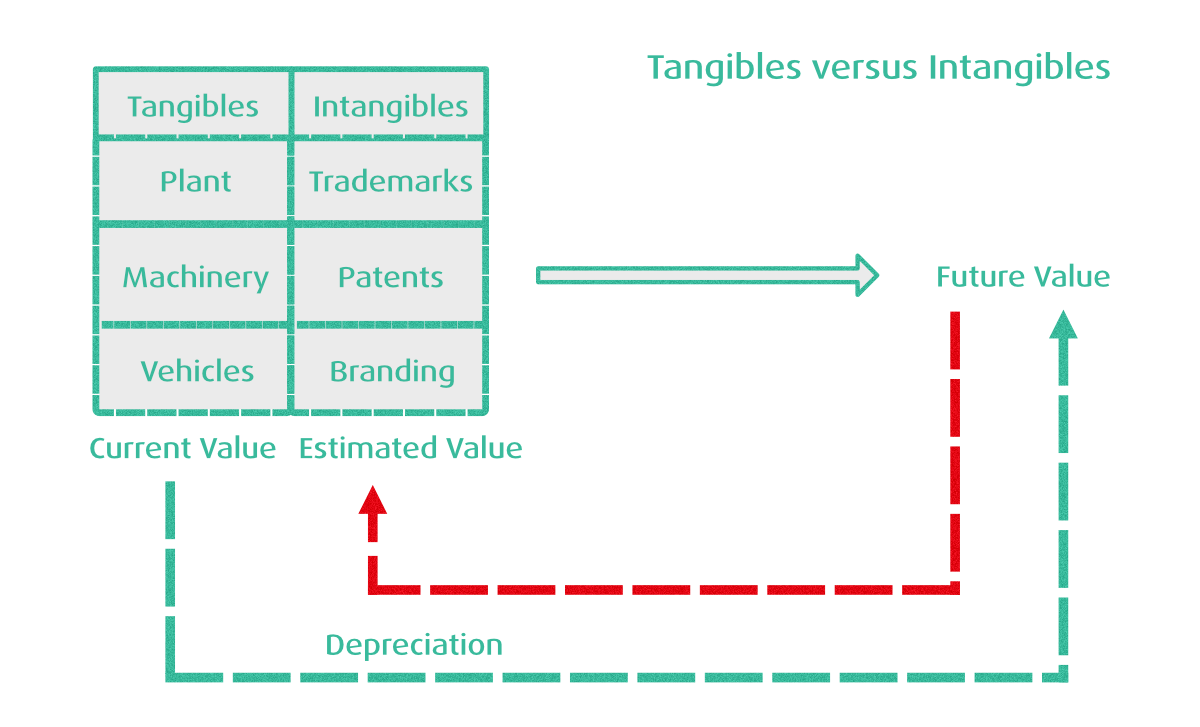
The fixed assets section captures plant and machinery, or other physical or intangible assets which enable company to trade.
The items such as factory tooling lose their value over time, and this process is captured as depreciation. The depreciation is provided to write off the cost consumed by the business over the asset's useful economic life.
The balance sheet shows the historic value and the element of depreciation. In that way we can see the net value of the fixed assets over time.
The main fact to consider is the understanding that depreciation is an intangible value. There are various conflicting myths surrounding depreciation, but for further reasoning, I refer to reference [1].
The best example I came across is the case of aeroplane engines, which could be depreciated according to hours which the engine has run.
The number of hours is strictly tracked, and the maintenance schedule would allow making a precise estimation of the costs associated with each hour flown. As I don't work in that industry, being a flight enthusiast doesn't make me an expert.
The Current Asset Section and Current Liabilities allow us to understand how well the company is working converting its production (or services provided) into cash, and how much capital is actually needed to run the operation.
What should be emphasized is that the term Current actually means within a year from the date of reporting.
The monthly or quarterly breakdown of the balance sheet thus allows capturing unpredictable events, as the outlook for the 12 months of the reporting period can change in our turbulent economy with 2-3 months.
As the professionals understand - the business owner needs to be aware of these uncertainties, as it is already too late when it is being relied solely on the past performance, while we're going through the current financial year.
In the next instalment of the series I will look at the logic around Working Capital, and Capital requirements.
The operating cycle of the business includes all activities which can be classified as input buying of the 'stock', adding value to it, and selling the products or services to generate profit (with associated activities to enable sales), followed by the cash collection from
customers.
The other cycle differentiated in the business activity is the investment cycle - purchasing tools, and means for production, or service delivery. We have described this process in the previous posts.
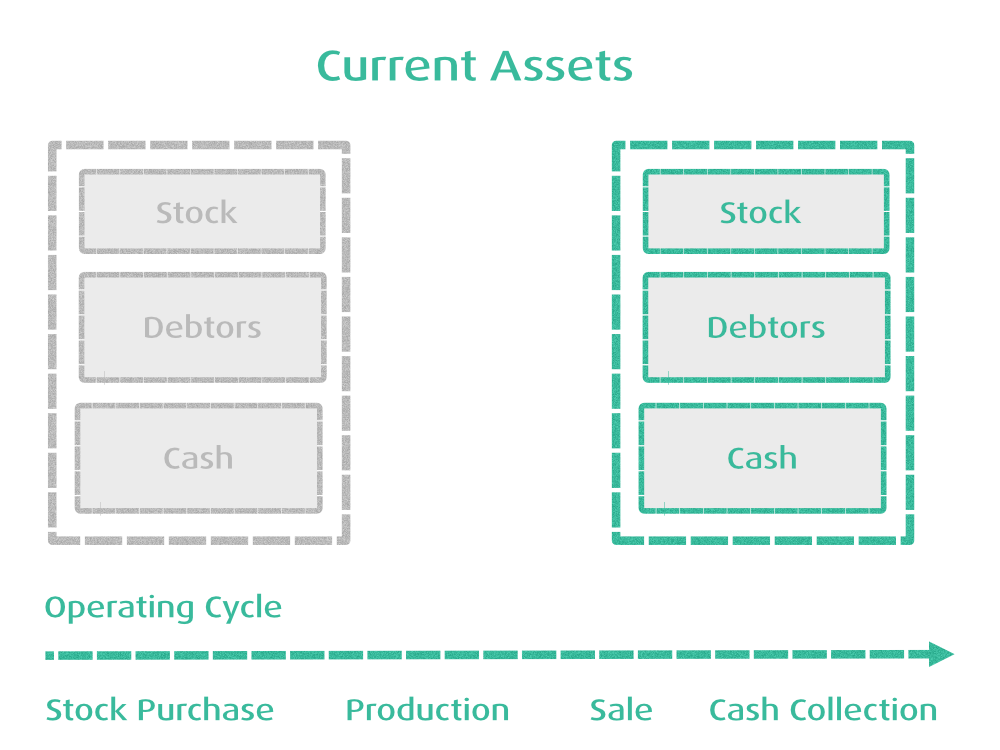
The operating cycle is mapped in the Current Assets section of a balance sheet. The lines of the section are usually sorted according to their liquidity. This section allows us to understand working capital requirements, as we see shortly, understanding the length of the operating cycle is a key information point to know how much money the business needs to fund its operations.
Assuming a very simple model, where a business needs 3 months to produce and expedite a bigger order, and it will take another month for the money to appear in the bank, we can clearly see that taking into account the fact that realistically the cycle can repeat 3x times per year (assuming holiday, illness and other factors), then a fictitious company will need a working capital equal to 4 months of operation, plus all the material costs, assuming a full recovery after each sale, and some profit margin.
As reference [1] explains, for every one pound placed in the business operating cycle, cash is recovered after some time period. In our example it is 4 months.
This measure is referred to as a working capital requirement.
Once we understand the cycle, it is clear that all we need to look at is
- Stock
- Debtors
- Cash
which tells us a lot about the overall story behind the business.
Depending on the amount of the annual sales are "frozen" in the inventories, work in progress, customer receivables, and account payables, we can calculate the ratio.
Working Capital [%] = Operating Working Capital / Total Sales
As a business owner, the main concerns can be two the requirement for the working capital is the first one. Each capital requirement costs money whether in the form of interest, or some other form. Including interest could make or break the business.
Finding some hidden advantages, to invoice, and cash customer upfront would be another option.
The reference [2] explains more on the subject in terms of growth, and recession. Both situations will check the company's ability to adapt itself to the conditions and manage the working capital requirements.
Finally, we will mention a few industry figures for the working capital ratios:
| Industry |
Working Capital Ratio [%] |
| IT Services |
8% |
| Software |
5% |
| Consumer goods |
12% |
| Transport |
-8% |
It is worth noting that companies able to cash upfront - such as transport, will have a negative working capital requirement.
---
References:
[1] Mastering Financial Management, Brookson S., 1998, London
[2] Corporate Finance, Quiry, P & all, 2005, Chichester
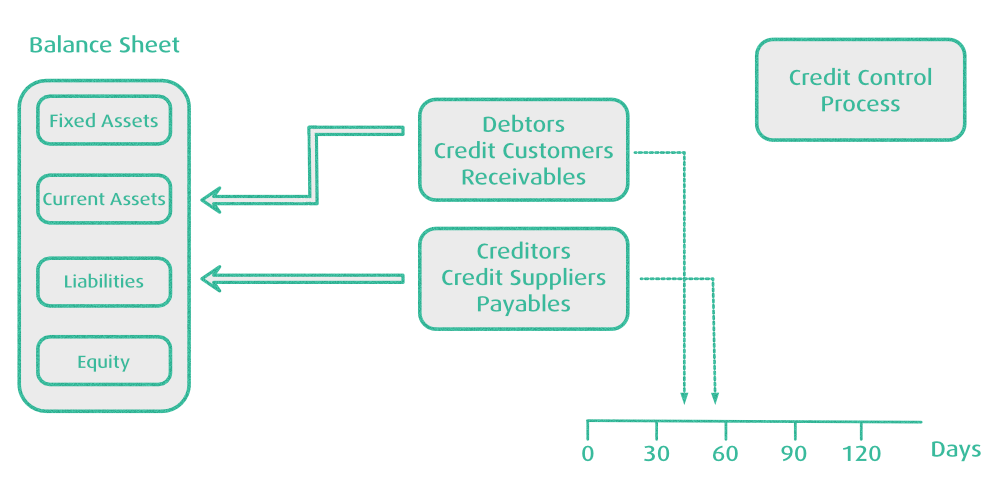
**Modern business relies on credit**, and the majority of the companies offer credit terms to their customers or receive it from their suppliers.
Customers who receive credit are known as debtors or receivables. Suppliers who provide their goods or services without receiving payment immediately are called creditors, or payables.
Debtors are Assets, as they represent money to be received in the near future. The opposite is true for Creditors – they are Liabilities because you have an obligation to pay the received invoice at a later date.
Managing carefully the time to collect payments, and paying bills when due, is a necessity.
It needs to be seen that Debtors are not cash, and they cannot be used to fund immediate cash needs of the business.
Each accounting software needs to allow users to issue or import the invoices and track payments made into Debtor accounts. Once the invoice has been paid by the customer (for Debtors), it gets out of the immediate focus.
Tracking unpaid invoices and their amount outstanding is the most common task to be implemented on any Accounting Software.
The outstanding balances are, in addition, categorised based upon how long overdue they are. In principle, the task can be easily implemented in any programming language or spreadsheet. The mechanisms can differ that either we account for a calendar month "step", thus talking about invoices due, within one month, two months, etc... after due date.
The more simple method is to use 30, 60, 90, 120 days. On a big scale of things, it is a detail, unless you don't have implemented some very strict penalty bands.
From a reporting perspective, the total outstanding balance is the same, but its aged debt categorisation might differ on a particular calendar day, especially at the end of months.
ProudNumbers implements both Debtors and Creditors reports and uses the latter method to calculate Aged Debt categorisation.
Being more practical, it is beneficial to remind ourselves how to manage the outstanding debt:
The process is called Credit Control, and consists of the following steps:
- review a new customer's ability to pay, check credit references, or collect an advance payment
- have clearly stated payment terms in a contractual agreement
- obtain evidence of delivery or confirm the delivery with the customer
- invoice every delivery and avoid part deliveries, as it causes confusion
- invoice promptly at the delivery time
- avoid ambiguity, have invoices with all 9 pieces of information as defined by HMRC
- confirm that the customer received an invoice
- regularly review outstanding balances
- implement a procedure to chase overdue payments - email, phone, letter
- don't hesitate to take legal action if necessary
- use factoring if it is economically viable, and necessary
The business owner needs to plan in detail for bad debt provision, depending on a particular line of business.
Debtor Days is a key indicator to follow, and it can tell us a lot about the payment patterns of our customers, and the overall market health, when looking back over time.
In principle, if your company Sales Payment T&C has a standard period of 30 days, then the collection period should be around 30 days as well.
So the Debtor Days indicator will show with clarity, how much longer it actually takes on average for your company to collect the money. We don't need to imply how critical this information is, and the fact that money is being collected has on the company's cash flow.
There are few established formulas differing only in their readability for a casual user, but [1] offers an easy way to calculate the indicator.
First, we compute at "Sales per day".
```
Sales per day = Total Annual Sales / 365
```
The indicator itself is also known as "Days Sales in Debtors" or "Days Sales Outstanding".
```
Debtor Days = Debtors / Sales per day
```
As we have mentioned, the ideal is to have customers paying on time or as soon as possible. As nowadays, most larger companies require much longer outstanding periods for payments of up to 120 days.
Having a mix of customers, the reader can easily see that while it is easy to compute to figure, we need skill, and experience, looking also onto customer behaviour patterns.
We must build an understanding how this number could fluctuate over time and what the business should do about it.
In ProudNumbers, we calculate this number from the outstanding invoices data, and payment history. As ProudNumbers delivers all KPIs information in one place, in monthly/weekly/biweekly/quarterly/yearly, the software has always to look back 12 months into the historical records -e.g. looking across two financial years—the current one, and the previous year.
This way, the algorithm matches the theoretical calculation definition but also accommodates for real-life situations.
This is where the computational power helps the human being, but interpreting eventual anomalies or trends is a task of making at Return on Capital.
As business owners, we tend to look at the Gross profit, and Net Profit, eventually things like Debtors, and Creditors Days.
While these KPIs are essentials, they plug in into a wider context defined as Return on Capital EmployedR (ROCE)
```
ROCE = Profit before tax / Capital Employed
```
A simple formula, with a deeper meaning behind. As the author explains in [1], we need to use share capital + reserves + long-term liabilities. All these figures are to be found on your balance sheet.
It is necessary to understand that lenders could be actually funding your business, therefore the inclusion of the long-term liabilities.
Sometimes we can use RONA - which is the same figure, as net assets are the same - fixed assets+current assets less current liabilities.
It is almost a question who teaches you the concepts, but it is clear. Once we compute ROCE periodically, we can see a yardstick indication, especially compared with other businesses in the same industry.
The infidelity in the ROCE is intrinsically given by the historical cost of assets. However, the historical costs may not reflect their real value, and vice versa. Therefore, many zeitgeisty companies could have an inflated or deflated ROCE. Also, many zombie businesses, as we're told by pundits like Peter Schiff, will simply be clinging on for years, as while their fixed asset base has depreciated over time, they will be still showing respectable numbers in ROCE, while they need an external injection of capital just to keep them going. But it is more of a task for stock-market analysts than accountants working for the SME sector.
From my personal point of view, the composition of long-term liabilities does quantify the risks of taking the investments, compared to your own equity.
Enough of my thoughts - for the readers it is better to stay within known means, what we can influence and look again at profit margins and your asset efficiency.
A business can increase ROCE by either increasing profits or decreasing its capital employed.
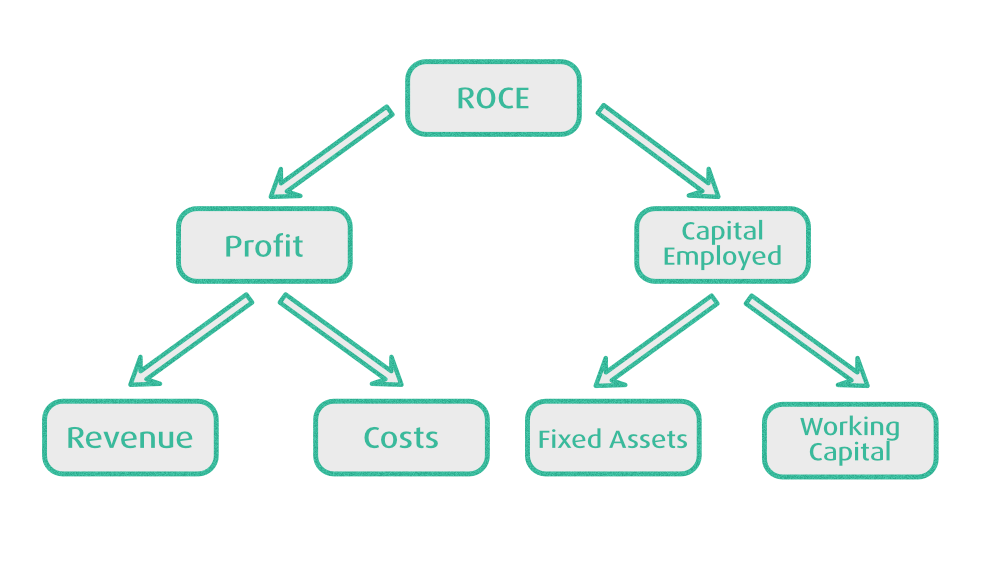
The ROCE is part of a larger picture, which is defined as the Tree of ratios. Looking at 2 roots of the tree - the profitability is one side, and the asset efficiency on the other side.
So as business owners, we need to focus our attention on both sides of the tree - Profit and Loss Report, and the Balance Sheet.
As the author says - how many of us do really so, and how well we are doing this in practice.
As I say in my disclaimer - computing the numbers correctly is a tool, but to interpret them properly for the readers requires experience to be sourced externally.
As our view of the software engineering business is always to know as much as we can about the domain aspect of the product we offer, this is my little contribution towards that goal.
---
_References:_
1. Mastering Financial Management, Brookson S., 1998, London
2. Management Accounting for Decision Makers, Atrill,P. McLaney E. , Pearson Education 2009, Harlow, Essex
One of the less known analyses is to look at your Cost of Sales, Direct Expenses, and Overheads, as percentages of Total Sales.
We all are accustomed to the Gross Profit, and Net Profit, so we can apply the same formula for the other elements contributing to the Net-Profit result percentage.
I've done that in my example, and over the years, I've been doing this analysis for my costs of software tools, server rental, and other production means.
Similarly, one needs to know the percentages of overheads, such as office rent, power, and light, and motor account expenses.
The attached image sums it up, as it shows a hypothetical forecourt, selling petrol, and diesel, together with a few other products.
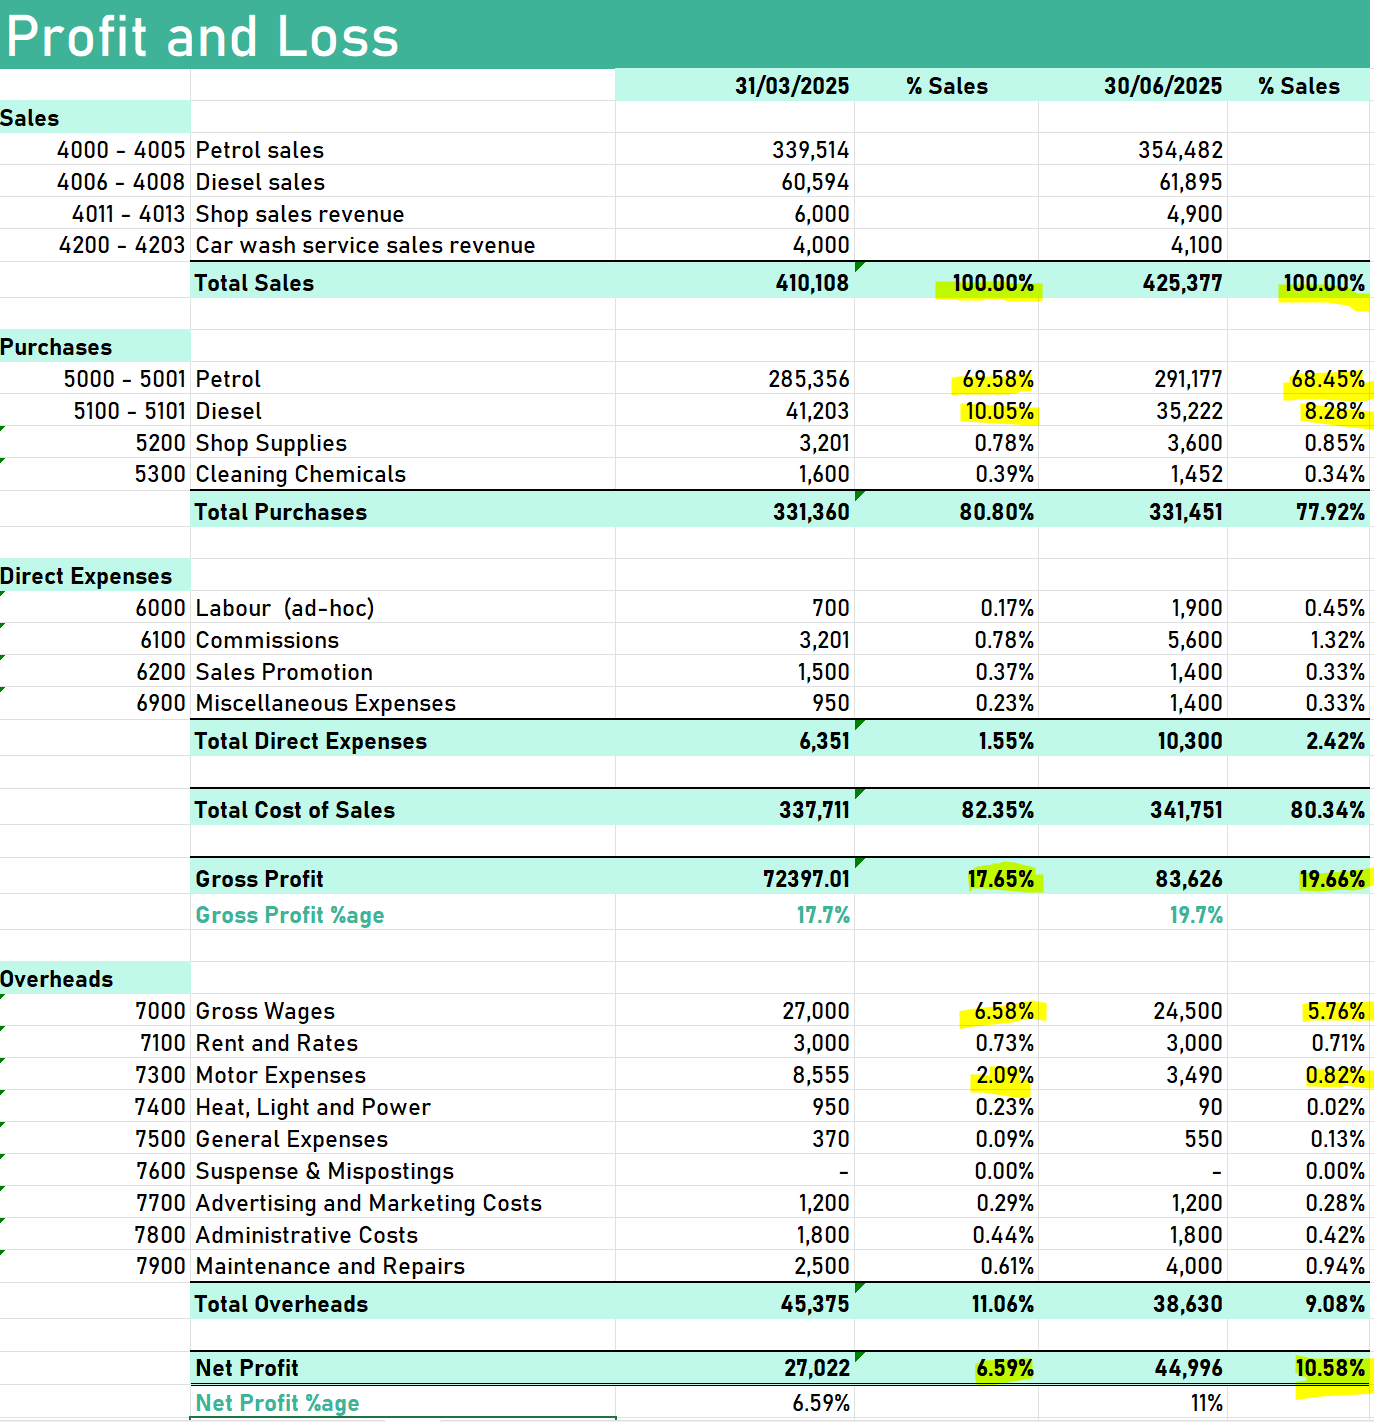
Knowing how the costs are fluctuating as a percentage of total sales gives you a "yardstick" measure - quoting [1].
To emphasise, we need to do this analysis in the time series—the example compares 2 quarters where as you can see, the gross profit margin increased 2 % from quarter to quarter, thanks to lower purchasing price of petrol, and diesel.
Also, the hypothetical company was able to save 0.9% on Gross Wages and save significantly on the cost of vehicles—(Motor Expenses) about 1.2%.
So all that "tailwind" helped to improve Net Profit by about 4%.
It is a hypothetical example, but as business owners we need to get accustomed to this way of analysing and knowing our economic performance. This is more than required in our current economic and political environment—simply knowing the past performance and estimate the future performance.
What I see as a customer of local businesses - servicing my car, speaking with electricians, or just walking around the industrial estates - the owners had to trim the staff headcount.
Even looking at my example, you can get that feel that increased overheads, with the same or lower sales just don't marry very well.
ProudNumbers can help the larger businesses, as each figure on the P&L in the program is drillable into underlying transactions, so the users can instantly see why some cost figure is unexpectedly high. The same functionality is available in the Sales part of the P&L.
Once that yardstick analysis is in place, the platform for improvement has been established supported by good practice.
In my last post about KPIs, we looked at the Return of Capital Employed. Thanks all who contributed to that discussion under post, it helped me a lot in my understanding of the metrics.
The good understanding of the domain helps us to develop quality software faster. The basic mathematics around accounting have been known to me for a long time, but some of the ratio concepts were not so familiar.
Today I want to share some of the Balance Sheet ratios.
**Asset Turnover**
This indicates how well an organisation is using its assets to generate sales revenue.
```
Asset Turnover = Sales / Capital Employed
```
The ratio is similar to ROCE, but it includes Sales, instead of Profits.
The ratio is very dependent on the type of industry, and service industries should show higher values than manufacturing companies.
The low ratio can indicate that the company is not generating suffcnt revenues in its sales.
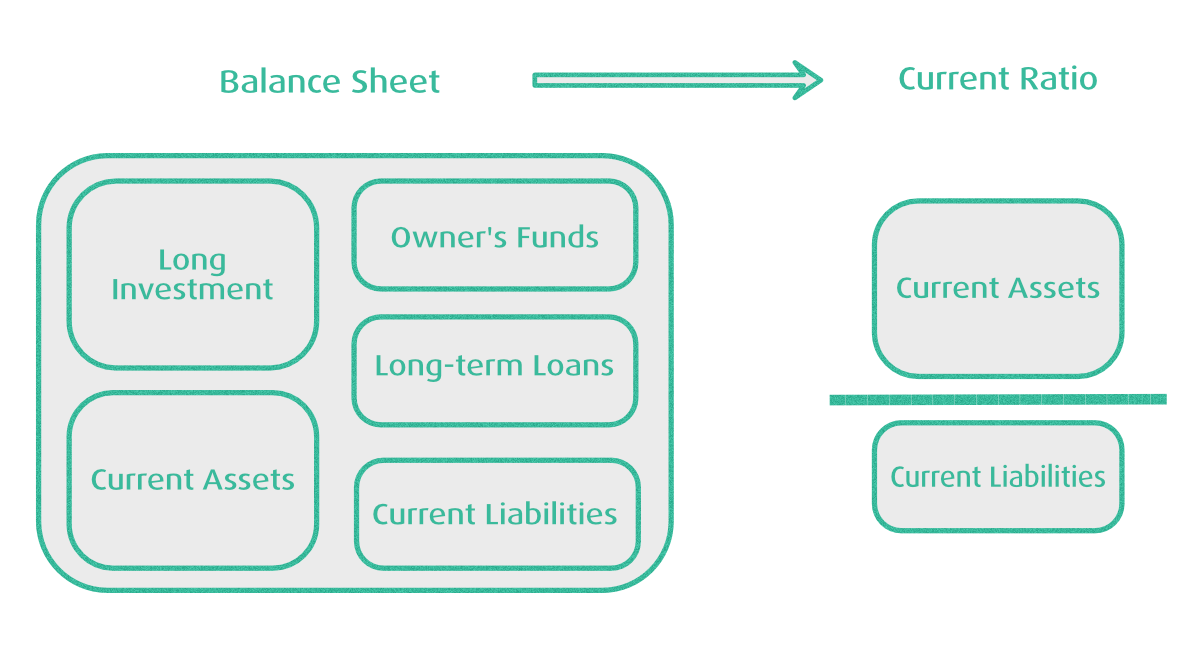
**Current Ratio**
```
Current Ratio = Current Assets / Current Liabilities
```
This is an accepted measure of short-term solvency of a company. As part of Current Assets is cash, or assets can be converted to cash in say 30-days, thus allowing that the company can pay its suppliers.
This ratio is a measure of liquidity, which means the ability to meet company obligations. On these forums, we're hearing a lot about problems which SMEs are facing by long payment terms from their customers, especially bigger organisations.
As literature [1] shows, the current assets comprise stocks, debtors, and cash. These factors need to be considered, especially for companies which need to keep stock levels high. Simultaneously, a bad debt will affect this figure, as not taking it into account would show a better financial position than reality.
The ratio is to be expected mostly in the interval 0.8 - 1.5 or wider boundaries of 0.5 - 1.8.
In addition, long credit terms also affect the figure.
**Quick Ratio**
The quick ratio is based on the assumption that stock will not be recovered quickly enough. Therefore, we need to exclude stock value from the previous calculation.
Current liabilities will therefore be covered from the following sources - debtors, and cash balances.
```
Quick ratio = Current Assets less Stock / Current Liabilities
```
This ratio needs to be compared across the industry. As literature suggests, the ratio should not be lower than 1. More than ever, sufficient cash flow management becomes crucial to manage the business effectively.
---
_References:_
1. Mastering Financial Management, Brookson S., 1998, London
2. Key Management Ratios, Walsh, C., Pearson, 2004
Departmental Accounting as an underused concept in the SME-s usage of accounting programs. Most businesses have some organisational structure, built around product or services, and it is underpinned by general administrative, marketing and sales functions.
The easy way to capture the organisational structure for a business in its financial reporting is through the use of departments.
The departments are defined tags, which are attached to transactions, when entering them into a double entry bookkeeping journal.
In Sage 50, these tags can be set up, and number codes are used. As it happens, these numbers will exist in perpetuity, but as business conditions change, a business grows, so do the departmental numbers, and sometimes it can get confusing, especially when a need to retire the department arises.
The departments are also called cost centres in the literature, and I believe that this term better explains what they represent. The cost centres associated with the production phases of the product give a better understanding of how costs flow from one phase to another.
The real problem comes to life where the indirect costs need to be allocated across all the products produced by a business.
This is more pertinent for the situation when the products are unequal, in terms of their complexity, or production procedure.
Knowing what is going on the shop floor and having the right apportioning figures in mind does help to get a good picture in terms of net-profit margins for the departments.
This is even more challenging for overheads, where some of our clients use a notion of Central Office, which is a separate cost centre. The other option is to apportion overheads between the product cost centres.
Coming back to reporting, it is possible to report for the departments in the monthly/weekly /bi-weekly breakdowns, so the real profit margin can be seen at each time interval. This could shed some light for the management team on the costs of inputs, and direct costs for the departments.
ProudNumbers offers an additional feature where the departments imported from the Sage 50 can be grouped into divisions.
This feature allows grouping together different departments, thus saving the management time, especially where there is clarity that 3 -4 departments contribute to the bigger product.
Again - this allows more effectively to work with overheads, as the overheads can be allocated only to some departments, knowing that they will bring up correct figures in the divisional reports.
This structure is applicable in Bdugeting & Forecasting module, thus giving further management control over the business, and planning the right resources, and tactical, and strategic decisions.
Overall, quality bookkeeping SOPs are needed to report correct figures, but no tool can replace a good accountant, organising the financial department properly.
In the past years, we have very much forgotten the human factor of accounting, but right tooling actually allows humans to do their job better, faster, and easier. Shall we say that ProudNumbers is truly pro-growth tool, so much being asked nowadays economy, and politics?
---
_References:_
1. Management Accounting for Decision Makers, Atrill, P., McLaney E. , Pearson Education 2009, Harlow, Essex
Being stacked into implementation of Cash flow Statement, I got a chance to learn the concept and mechanics myself. All accounting books out there put their attention to this crucial part of financial statements, but each author rightfully points his focus in his own way.
The FRS1, and FRS102 normative gives us a clear picture on how we should report our cash flows from Operating, Investing, and Financing Activities.
The goals to fulfill are twofold:
- show cash generation and cash absorption in a well-structured manner
- provide information about liquidity, solvency, and financial adaptability
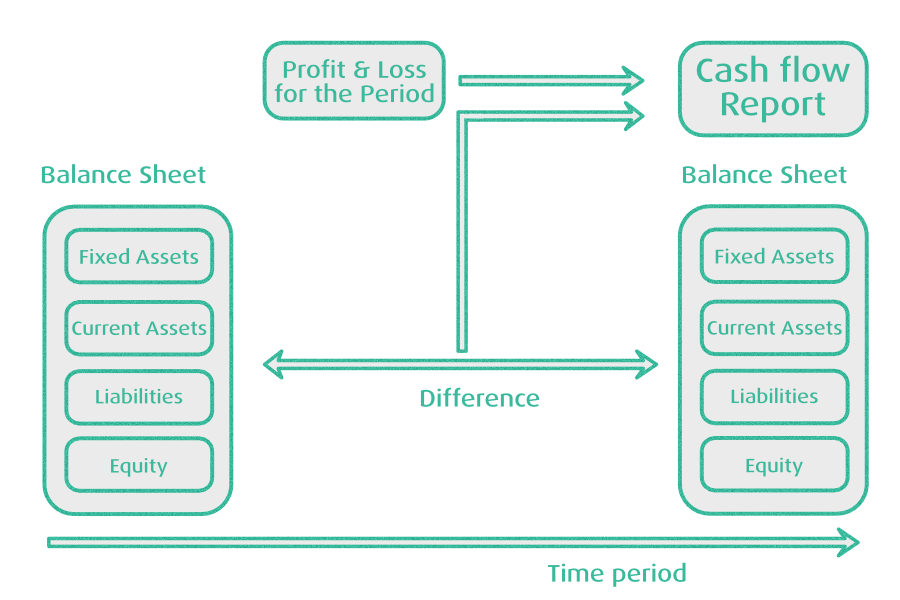
The statement must tally up with the other two parts of Financial Statements
- P&L - operating profit, and net profit, and the movement in net debt from Balance Sheet.
The essence of the statement is to show where actual money comes from and where it goes. The increase/decrease in Stock/Debtors/Creditors is the key to understanding how the Cash flow changes have manifested over the captured period of time.
**The three main categories of the Cash flow Statement contain the following items:
**
✅ Cash flow from Operating Activities
- Net profit
- Depreciation
- (Increase)/Decrease in Debtors, Creditors, Stock, and Accruals
✅ Cash flow from Investing Activities
- Sale/Purchase of Fixed Assets
- Sale/Purchase of Investments
- Acquisition of Businesses
✅ Cash Flow from Financing Activities
- Proceeds from Issuing Shares
- Repurchase of Shares
- Proceeds from Issuing/Repayment Debt
- Dividends Paid
- Loan Interest Paid/Received
As it happens, the structure needs to be carefully adjusted for a particular company. But the principle stays.
In the software, the complexity gets high very quickly. In our software ProudNumbers, the categorisation of the Nominal Accounts needs to be done manually in the beginning, once, using simple Drag&Drop Editor. The nominal codes are colour coded that cash accounts can be excluded, while defining the report categorisation as described.
The described report statement is classified as "indirect" in the FRS102.
The more simple report, which captures only cash flows related to bank accounts, and all other cash accounts, is classified as "direct".
Having seen the description above, you intuitively feel how both reports are the same but different. The first report describes one part of the double entry system—changes on the Assets/Liabitilities/Equity side, the other part purely capturing cash movements in the Bank/Petty Cash accounts.
As always, for more complex business models, you need to adjust your reporting, and your accountants will help with that.
Programming of the complex systems, and achieving a discoverable UI, is a challenging task itself. Sometimes the sums just don't tally up immediately, as somewhere there is a mistake in the calculation. I will share such a story later in this series.
---
_References:_
1. How to Pass Financial Accounting, Level 4, Smyrniou, O., LCCI Examinations Board, London
2. FRS 102, The Financial Reporting Standard applicable in the UK and Republic of Ireland, 2024
3. Key Management Ratios, Walsh, C., Pearson, 2004
The perennial problem of estimating the cost of a larger project has been with me since around 2005. Once I joined the ranks on self-employment back in 2007, it became even more important to eliminate the guesswork and come to some methodical approach of estimating work to be done.
Simultaneously, as we provide a simple budgeting tool for our clients in the ProudNumbers management accounts, there are many common traits between budgeting for business and estimating costs of the software project.
Speaking about estimation methods, our natural reaction to the question "How long will it take?" is to give an answer, which usually matches our experience with a given problem.
The duration of the past implementation of a similar solution, and some kind of reasonable reserve form the final figure. The answer always depends who is posing this question.
Similarly, the business owner will relate to his previous year's trading results, in order to estimate a new financial plan and forecasted revenues.
While the single point estimate is most frequent, it is a point where we need to start, but more needs to be done.
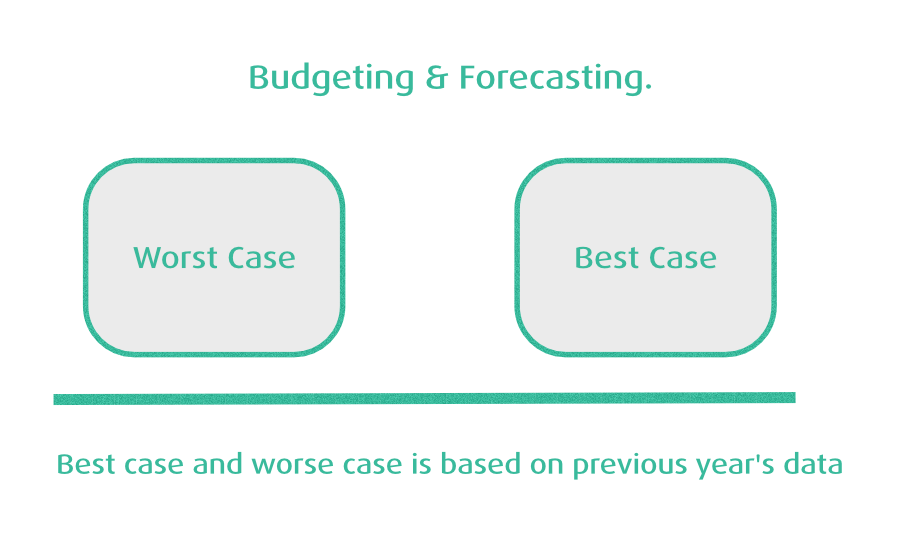
Especially nowadays, the uncertainty of the future economic situation is very high. The business owners need to reflect this, doing their best case scenario planning, the worst case scenario analysis, and the most likely case.
The probability of which scenario is going to happen, and how to calculate it is a subject for PhD thesis work. I think the probabilities depend on the estimator and his experience from similar situations.
As always, doing, according to known practices, will help, and capturing the likelihood of the scenarios needs to be done.
In software engineering the well-known author Steve McConnell talked about 2-point estimate—minimum, and maximum time needed.
Our experience tells me that the maximum time is usually connected with the problem of guaranteeing the delivery at all, which for very risky projects can be an issue.
The usual problem is that certain costly projects could be economically unviable, so it is all about the most likely project outcome, with the budget which guarantees a successful outcome for the client.
The notion of the 3-scenario project estimation is the same as the 3-scenario budget planning.
If we leave the notions of standard deviations, advanced statistics, and we use common sense and take our accountant's advice, we can conclude:
The forecast is as accurate as possible in the given moment - when it was made. So we can estimate the best we can, however, once the real figures start to come in, we need to assess our budget, of course extend it into the future for the month just passed.
Furthermore, we will reassess what has changed.
The final takeaway point from this post is perhaps always thinking about a future budget as the best, and worst case budget scenarios.
The idea of this post is to recap some of the key ideas from my previous post on Estimating and Budgeting.
As most of us should, and hopefully will transition from that one figure estimating and budgeting mindset into a concept of a range with minimum and maximum cost for each line on the budgeting work sheet.
As we call for simplicity, let's now try to think about an instruction set to create a best case/ worst case scenario estimate for our project.
In the first instance we will need to think about splitting a bigger project into smaller manageable chunks.
Once we split the project into tasks and line them up in the spreadsheet, we need to think about task overrun.
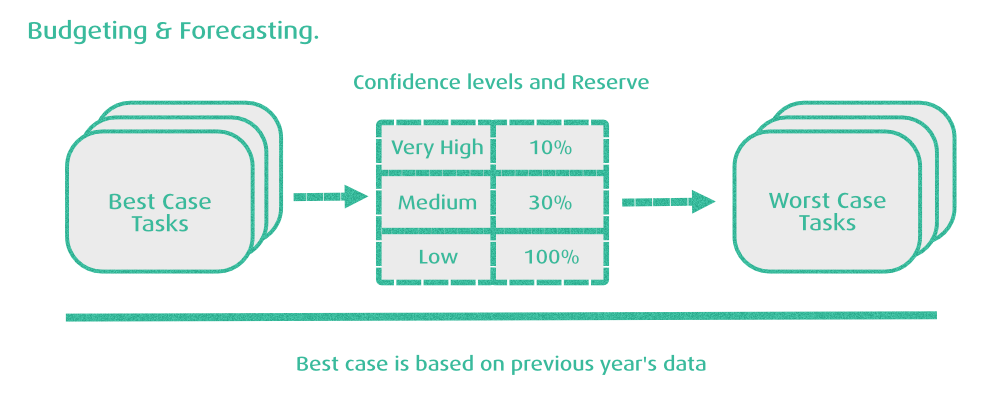
Having said that, we may think about each task and first enter our best case figure into the spreadsheet. The best case figure is usually based upon our previous experience or knowledge of the same type of activity in the past.
Once we have that best case number entered onto the worksheet, then we need to think to start about the confidence level on this particular piece of work. If our confidence level is absolutely high, and we know that this is the same task as has been done many times before, we can map our confidence level against the risk associated with the task overrunning and assign an appropriate percentage for it.
Let's assume that our confidence level is very high. Therefore, we allocate 10% reserve for the budgeted cost of the task.
So we're now ready to calculate the total amount of money budgeted say
£1000 for the best case and the worst case scenario is £110.
Now things can get complex very quickly.
Let's assume that our confidence level varies somewhere around the 70% mark - so in that case we would add a reserve 30%.
If our confidence level is low, our reserve inevitably must be very large too, and we use 100% or more dependent on what type of project we are working on and what is the novelty factor for us.
So essentially we can conclude
| Confidence | Reserve |
| High | 10% |
| Medium | 30% |
| Low | 100% |
The granularity of 3 levels is the arbitrary minimum, and surely for your type of project or budget, you will find a better fit with more levels, but honestly having more than 5 is not advisable.
So once the spreadsheet fills up, we see items with various confidence levels and can summarise the project into a range figure - the best case, and the worst case scenarios.
Obviously, depending on the nature of the work, industry sector, and other factors like hourly rates, it becomes clear where the cost overrun could happen.
One needs to understand that once the task overrun happens, it overruns massively.
So our 100% reserve in this example can meltdown very rapidly for such a task, and the scale of confidence and reserves needs adjustment.
What is your experience with confidence levels and estimating reserves?
---
Our experience maps the possibility - it is not an exact science - and many times it is about scoping the work correctly to avoid a 400% budget blowout. But as I said - a critical task overrun can make a project go off track, blow the budget, and cause massive delays.
---
_References:_
1. Mastering Financial Management, Brookson S., 1998, London
2. Software Estimation: Demystifying the Black Art, McConnell, S, 2006, Washington
As the intangible nature of software and its long-term benefits to the business are increasingly recognised, most of the time we need to find some more suitable model to capture these values in our accounting systems.
The facts are certainly well known nowadays, and in most cases to account correctly, you need accountants working in the R&D space, knowing current legislation, and HMRC guidance.
In principle there are 3 phases when recognising the cost of the software project, including R&D.
These phases are
- Preliminary R&D Phase - to be expensed
- Technological Feasibility hase - to be expensed
- Development until Product Release - to be capitalised
- After Release Maintenance - to be expensed.
Now let's little decipher the issue of capitalisation vs expense. In principle, the value, which has been created during a period of Development, can be recognised as a Fixed Asset. Again - this is an intangible asset with no physical existence, but the nitty-gritty of the legislation requires expert in the field.
This can be complicated by the fact that UK Legislation allows R&D credit, where some part of the expenditure on development may qualify for tax relief.
The methodology is relatively well-known these days, perhaps 10 - 20 years ago things weren't so ubiquitous as the intangible asset value was not so dominant.
According to literature, intangible asset creates a major part of the balance sheet of the world corporations, and we all witness it.
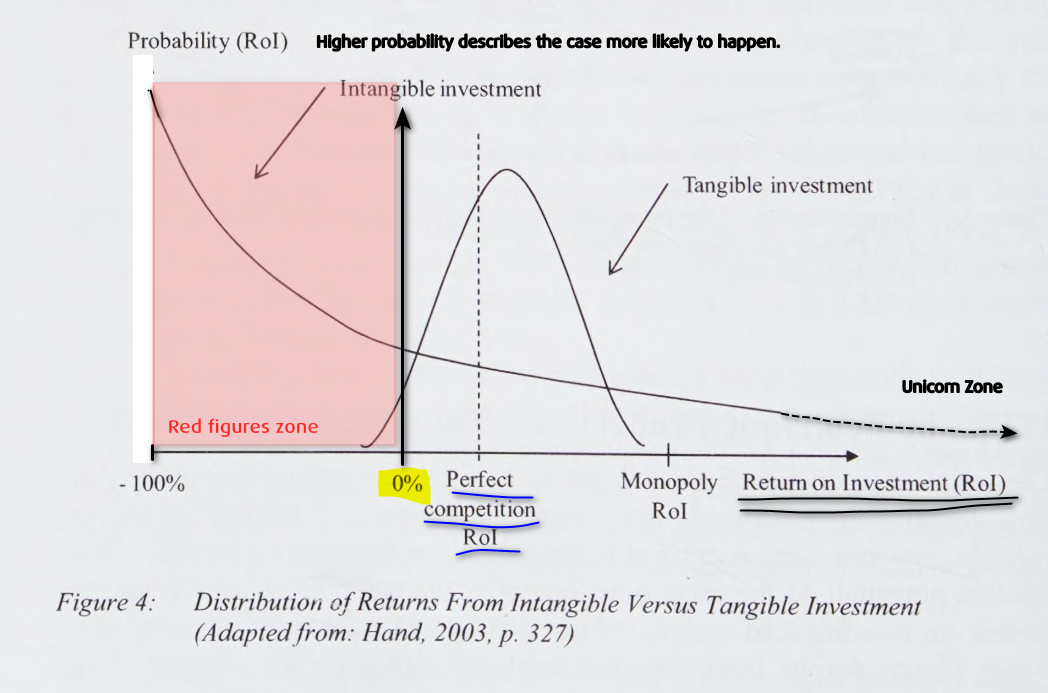
The more interesting part is to look at the risk connected to ROI on the intangibles vs tangible assets.
As we see from the chart below, the probability for the ROI for various levels of ROI can be seen.
The horizontal axis describes the level of ROI - by no doubt many projects are a total write-off for 100%.
Unfortunately, the literature doesn't quantify the probability itself, but we can estimate this to be easily around 0.9 or higher.
How to get into positive ROI-s is a completely different topic. As we can read from the chart, the probability of the level of ROI = 0% is also non-negligible.
However, once we pass a Monopoly Level of ROI - we can essentially achieve multiple times our investment back, however, the probability drops significantly as well.
So that is that layman carrot on the stick - a mythical unicorn in terms of business value creation. A gospel of progress, delivering results and making money out of nothing, which is actually a great fallacy. If you don't see something and cannot touch, it doesn't mean nothing, and for example, increasing costs of energy can become very palpable in the AI times.
The investment into tangibles mirrors a bell-shaped curve, and as [1] says, the investment into buildings and machines is at least partially recoverable. I would emphasise the word partially as state dirigisme might make the recoverability very dubious.
---
_References:_
1. Accounting for R&D Investments, Ordosch, M., Peter Lang, 2012, Frankfurt Am Main
2. An Analysis of Application and Accounting Standards to Computer Software and Website Cost, Sharadha N, Manickavasagam V, International Journal of Trend in Scientific Research and Development, Vol. 2, Issue 1, 2017
3. Intangible assets, Values, measures, and risks, Hand, JRM, 2003, OUP, Oxford
We know that the intangibles are notoriously challenging to develop and commercialise successfully. Speaking with a friend who works as an accountant, we discussed my recent post "Capitalizing on Software Development". He asked why the probability of losing the investment was so high for software, compared to other types of investment into physical goods or services.
Developing a technology, or even applying existing technologies to solve a problem in an innovative way, carries risks in terms of cost overruns, delays and failure to deliver value. We know all of these things from experience, but digging deeper reveals some interesting insights about how this risk manifests itself, which may help us understand what makes it different than developing tangible products.
As I learned examining the literature reference, a lot of research in this are was done by Baruch Lev, professor at Stern School of Business New York University.
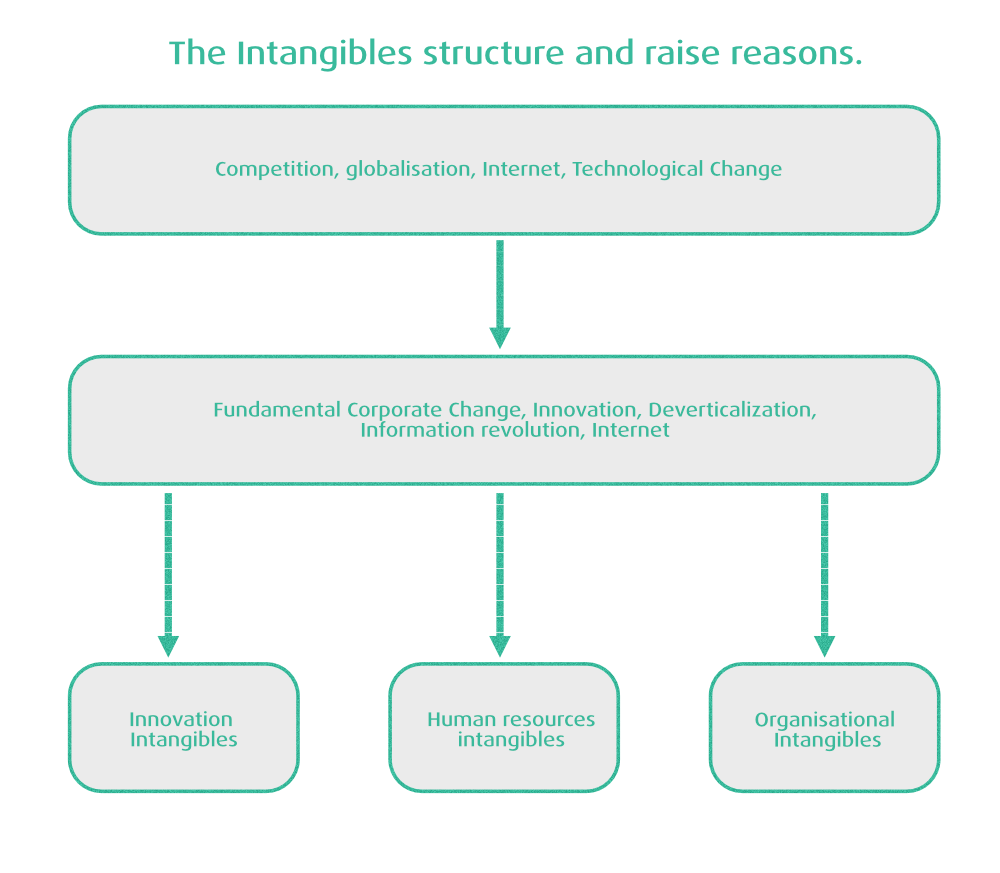
Lev starts with dictionaries definition—intangible as "incapable of being defined or determined with certainty or precision". He then goes further and defines an intangible asset as a claim to future economic benefits that does not have physical or financial embodiment. Examples include patents, brands, and unique organisational structure—e.g. an Internet-based supply chain.
Lev differentiates three nexuses of intangibles - discovery, organisational practices, and human resources.
As Lev work was published around twenty years ago, we can understand that the book value of intangibles rose in the order of magnitude as compared to the 1980s.
The drivers behind the growth of intangibles are the Internet, connected economies, and globalisation. The example he gives is Ford Motor company, which he noted:
Economies of scale for manufacturing cars exhausted well below the scale of total market dominance.
As the company grew larger, the additional manufacturing capacity turned bringing loss, however, the management costs of the organisation grew as well, most likely disproportionately.
That is why the outsourcing took its place, and companies turned towards intangible assets to find new drivers of profitability.
As the competition intensified, so the run for the intangibles became more intense, and the number of workers developing intangibles increased dramatically - 2x between year 1999 and 1980.
If it's so good...?
As Lev notes, an important problem for intangibles is the scale of the market. Many markets have a limited size, or niche is so small not worth investing in them.
But the critical problem is the managerial diseconomies. Managing a physical asset is relatively easy and well-explored. However, some novel code basis itself can be a source of major headaches.
Here we're slowly seeing the risks emerging.
We're not talking about anything shipped yet into the hands of customers, which immediately calls the old rule - that no software survives the first day with customer intact.
Understanding the cyclical nature of economic activity is important for many reasons, including own economic planning, business success, and strategy to be chosen.
All businesses have two cycles: the capital investment cycle and the operating cycle.
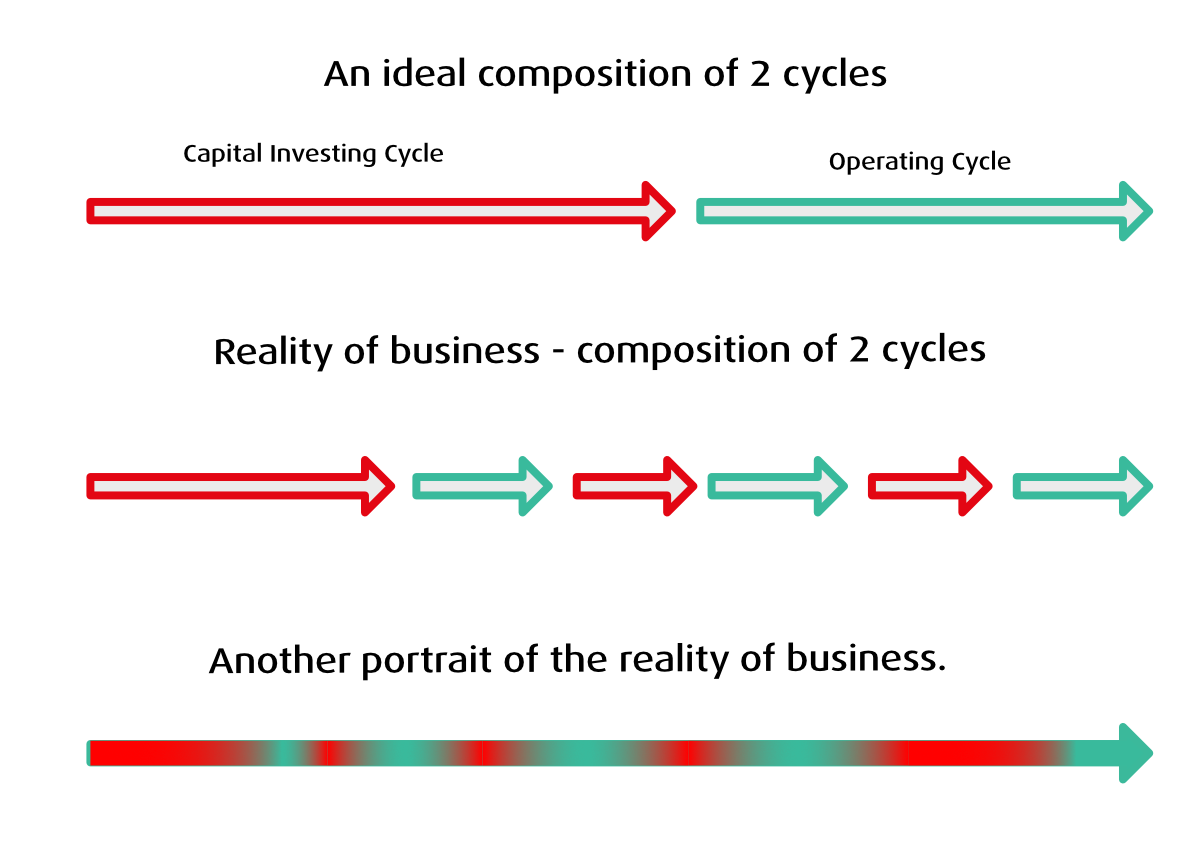
The operating cycle, is straightforward - goods and services are bought in order to sell them later on at a profit. The efficiency of the operating cycle depends primarily on how fast the turnaround of goods and services the company is able to achieve. Obviously, the proportion of bad debts, solvency of the clients, and collection time of the issued invoices will affect the operating cycle.
The capital investment cycle is a measure of how much is invested in the capital infrastructure in order that a business may carry out its operating cycle. A good example is any kind of manufacturing business which needs plant, and machinery ready, in order to execute their production process and operating cycle.
In general, it is expected that the manufacturing business has larger investments into fixing assets, as compared to service-based companies.
My first encounter with this concept was rather late in my 'business' career, when a prospective client concluded that my very good consulting proposal would just take too much of his time, and also reasoned the length of the business cycle as 18 -24 months.
Looking back at various software projects, whether self-invested, or being pursued by companies where I worked for them, the expectation was mostly unrealistic. Just looking at that figure 18 - 24 months, which I fully vouch for, it is evident that the 3-6 months timeframe is just enough to understand the problem statement, or craft some very basic solution, but not more than that. Being asked for a 3-6 months delivery scenario should be a warning sign that the other party needs more information to be aware about the length of capital investment cycle vs. operating cycle.
Again, for the purpose of clarity - these requests I'm talking about are for delivering software products, immediately able to enter the second phase - operating cycle, and being sold on the mass market.
The software micropreneurs (a 1 man company) could be in a little more favourable position, as they are able to work alone, while keeping their job. The prime resource in this area is posts, interviews, and the blog of David Heinemeier Hansson, who is a proponent of this model. DHH elicits 10h per week as a good work-duration investment, which, when sustained for a longer period, can lead to massive progress.
We can think about making the cost of the capital investment cycle cheaper, in principle.
In reality, there is a need to account for the cost of lost opportunity, but these concepts and accounting for them could be dubious.
In the next post of the series, we will look again on IP valuation, incorporating the 2 cycles.

The subtitle from the book [1] by Baruch Lev opens my next post on the series. In the last post we touched the 2 business cycles - investing, and operating.
Valuing the intangible product, which may be a result of the investing cycle, and developed by a company during its period, could be a challenge for an investor or analyst.
This claim is the concept of Lev's work, where he argues that the intangible assets are most time valued incorrectly. The intangible's valuation, in the SME scenario, could get more aberrated than in an international corporation.
As we pointed out before, the inherent risk of loss on the investment into intangible asset development can be compensated with higher returns if it pays off.
Lev examines a few bigger corporations and analyses their intangible investments. He concludes that investment into basic research brings much better return than other types of R&D - as compared to applied research.
That is pertinent in the SME scenarios, where us as a micro company, a small software development firm, have to be aware of our own capabilities and understand what kind of projects will bring value back. And how much this return could be.
"To know the past, one must first know the future."
This counterintuitive yet profound statement by
the mathematician Raymond Smullyan, though not referring to accounting, reflects the essence of accounting measurements, their objectives, and limitations better than any textbook discussion. [1 - pg.81]
Several examples of this big claim make its relevance clearer:
- the net value of accounts receivable depends on the amount of bad debt
- the net value of plant and equipment depends on the validity of depreciation assumptions
- pension obligations rely on long-term projections about future wages increases
In general, the shorter the reporting period is, the less accurate the real behaviour of the company or market can be captured.
That is why very short reporting periods may bring more noise in financial statements` than signal.
The longer reporting periods - looking at three to five years will bring more accuracy in capturing business trends.
Concluding our review on intangibles, it becomes clear that many times we are entering murky waters. A well-known example of epic failure was the Iridium satellite project, which lost around $5 billion dollars before being abandoned by Motorola and partners. It will stay in the history books as one of the biggest intangible failures ever.
For SME microbusinesses, it is important to keep tight control over the project budget and keep working through the investment cycle long term with minimal cash burn, and build further while bootstrapping the business.
What are your thoughts on managing the risks of investing in intangible assets and developing them in your company?
---
Many ideas in this post are coming from the book and work
by the Profit-First Methodology group, also working in the UK.
Their book Profit First is a great advisory source on growth and practical financial management for SMEs.
Thank you to Tim Seymour for sharing the book with us.
---
_References:_
1. Intangibles: management, measuring, and reporting, Lev, B, 2001, New York
My name is Pavol Rovensky, and I am a programmer working on B2B software for over 30 years now—since the summer of 1992.
I also run my own company called Hexner Limited, and this organisation develops and markets ProudNumbers Management Accounts for Sage 50.
❓ What problem does ProudNumbers solve?
Sage 50 reporting requires the user to run reports one-by-one, the export to Excel does not preserve the formatting and doesn’t generate sums in the shape of spreadsheet formulas.
❓ What does ProudNumbers offer?
ProudNumbers allows generating all management accounts at once with the click of a button.
All sums in the ProudNumbers spreadsheet can be drilled down into individual transactions.
🧮 Furthermore, ProudNumbers internally opens past P&L Ledger to report on historical data, whether it is a past year, or 5 years ago. This is very useful for analysing trends and planning for the future.
❓ Can I export these spreadsheets to Excel?
Yes, of course.
❓ Who is this for?
👩 👨 The accountants who appreciate the industrial strength of the holistic solution for the Management Accounts they face every month, especially those working in the industry.
Also, the accounting professionals serving as independent FDs delivering value-added services to their clients.
❓ How about a trial version?
We offer a free 30-day all-features trial period, no questions asked, and no credit card required.
Contact us any time.
❓ How is the software supported after purchase?
The subscription includes the availability of our company support team to help you 365 days in the year.
❓ Is the solution suitable for small businesses?
It takes only 5 minutes to set up and run the Management Accounts reports.
The whistle-stop tour of the system can be completed in less than 30 minutes. All the documentation and manuals are available online, including instructional videos (Documentation and Blog Section on our website).
❓Still not convinced?
🙂 Here is the e-mail answer from one of our customers on the update announcement:
**"Many thanks for your email, great updates to Management Accounts both will be useful. I find ProudNumbers pretty seamless to be honest I don’t have any issues using it at all and I have to deal with other providers UI a lot in accounts and payroll, so many are dreadful, your software is a marvellous help."**
The photograph is courtesy of Aisling Magill.
☎️ Please call or write any time if we may assist further!
https://hexner.co.uk

Guest Chapters
**About the author.**
**Rob Newman** is a Managing Partner of the accounting firm **Carter Collins & Myer**, a thriving accountancy firm in Manchester & District.
Rob is a business owner, accountant and tax advisor who spent 25 years working with the business owners of small businesses in the UK.
His personal passion for helping business owners, delivering impartial and analytics advice using management accounting skills, knowledge and experience has brought valuable addition to this online book.
As an active karate teacher, he teaches traditional karate.
He can be contacted using the following link https://calendly.com/robert-newman to book a meeting.
# Why Do We Have Management Accounts? #
**Written by Rob Newman**
##The Difference Between Feeling Successful and Being in Control##
There comes a point in the life of every serious owner-managed business where instinct stops being enough.
Up to a certain size, you can run on feel.
You know your customers personally.
You remember most invoices.
You have a rough sense of what’s in the bank.
You can “tell” when things are tight.
You can “tell” when things are good.
That works at £400,000 turnover.
It sometimes works at £900,000 if margins are generous and overhead is light.
Between£1 million and £5 million turnover, it becomes dangerous.
This is the bracket where complexity compounds quietly.
You employ more people.
You sign longer leases.
You carry more debtors.
You collect more VAT.
You accrue more Corporation Tax.
You increase fixed costs.
You increase your personal exposure.
And yet, I still meet £2m and £3m businesses being run on instinct.
The owners are intelligent. Capable. Often technically outstanding in their field.
But the internal financial discipline has not caught up with the scale of what they are now operating.
They say:
“We do the year-end accounts. Isn’t that enough?”
No.
It is not enough.
Statutory accounts tell you what happened.
Management accounts tell you what is happening.
And - crucially - what is likely to happen next.
That distinction is not administrative. It is foundational.
This chapter sits early in this book because management accounts are not an upgrade. They are a line in the sand. They mark the moment a founder decides to professionalise.
- - -
## Compliance Is Not Control ##
Let’s clear something up immediately.
Having bookkeeping is not the same as having management accounts.
.
Filing VAT returns is not the same as having management accounts.
Producing annual accounts is not the same as having management accounts.
Those are compliance processes.
They exist because the law requires them.
Annual statutory accounts are retrospective summaries of a completed financial year. They are designed for external users - shareholders, lenders, regulators, HMRC.
By the time you receive them:
- The year is closed.
- The decisions are made.
- The cash has moved.
- The dividends have been paid.
- The tax is fixed.
They are historical.
Useful, yes.
Operational, no.
Management accounts are internal, periodic and decision-focused.
They exist for directors.
They exist to change behaviour before year-end.
They are not about satisfying Companies House.
They are about running a business properly.
If you confuse compliance with control, you are operating in a comfort illusion.
- - -
## The Growth Trap ##
The most dangerous phase for a £1m–£5m business is not decline.
It is growth.
Revenue increases.
You hire.
You move premises.
You invest in systems.
You upgrade vehicles.
You add management layers.
Everything looks positive.
But growth consumes cash before it generates it.
When turnover increases from £1.8m to £2.6m:
- Debtors increase.
- VAT increases.
- Payroll increases.
- PAYE increases.
- Corporation Tax increases.
- Stock or work in progress may increase.
- Overheads step up.
Growth stretches working capital.
If you do not measure that stretch monthly, it can become invisible until it becomes painful.
- - -
## Profit Is Not Cash - And Never Has Been ##
This is the lesson most SMEs learn under pressure.
Profit is an accounting concept.
Cash is survival.
A company can show £280,000 profit and struggle to pay VAT.
How?
Because profit includes income not yet collected.
It may include:
- £350,000 sitting in debtors.
- £150,000 in work in progress.
- Capital expenditure already paid for.
- Tax not yet settled.
Profit does not automatically equal liquidity.
Management accounts reconcile:
- Profit.
- Working capital movements.
- Tax provisions.
- Cash position.
- Facility utilisation.
They answer a brutally simple question:
“Is the reported profit actually turning into cash?”
Without that discipline, directors assume strength where fragility
may exist.
- - -
## Working Capital: The Slow Erosion ##
Let’s break working capital down properly.
Working capital is broadly:
```
Debtors
Plus Stock / WIP
Minus Creditors
```
It represents the net cash tied up in day-to-day operations.
In a £3m business, small percentage shifts create large cash movements.
If debtor days move from 45 to 75 days:
On £3m turnover, that is roughly £250,000 extra tied up in receivables.
That money is no longer in your bank.
It is funding customers.
Now add:
- VAT on those sales.
- PAYE on increased staff.
- Corporation Tax building quietly.
If you do not monitor this monthly, you will not see the strain building.
Most SME crises do not arrive with a bang.
They drift.
Debtor days stretch.
Creditor days stretch.
VAT is paid at the last minute.
Corporation Tax is mentally parked.
Director drawings continue “because we’re profitable.”
Each decision feels rational.
Collectively, they alter liquidity.
Management accounts surface that drift early.
- - -
## Case Study: The Business That Almost Broke Its Founder ##
Let’s call the company Eastfield Projects.
Turnover: £3.4m
Sector: Commercial refurbishment
Employees: 24
History: 9 years of growth
The founder was commercially sharp. He could price well. He understood risk. He had survived earlier slow periods.
He did not believe in monthly management accounts.
He reviewed bank balances.
He reviewed VAT quarters.
He reviewed year-end accounts.
Revenue grew 28% over two years.
He hired project managers.
He increased subcontractor capacity.
He moved to larger premises.
He took dividends consistent with previous years because profit appeared strong.
He did not see:
- Debtor days moving from 52 to 87.
- Gross margin on new contracts 3% lower than historical average.
- PAYE rising sharply due to overtime.
- Corporation Tax underprovided mid-year by £70,000.
- A director loan account quietly overdrawn by 95,000.
The trigger was mundane.
A major client delayed payment due to internal approval processes.
Simultaneously:
- A VAT quarter of £140,000 fell due.
- Payroll increased due to contract intensity.
- A vehicle fleet replacement deposit was
required.
The overdraft limit was reached.
HMRC VAT was paid late.
A Time to Pay arrangement was negotiated.
Sleep deteriorated.
At home, conversations changed.
Not because the business failed - it did not.
But because confidence had been replaced by anxiety.
When proper monthly management accounts were introduced, the clarity was immediate:
- Margin compression had been real.
- Growth had absorbed cash.
- Dividend policy required linking to distributable reserves.
- Debtor management required tightening.
- Corporation Tax needed provisioning monthly.
- Capital expenditure required staging.
Within twelve months, stability returned.
But the cost was:
- Twelve months without dividends.
- Personal borrowing to clear the director loan.
- Loss of sleep.
- Stress carried home.
The business survived.
The founder paid for delayed visibility.
- - -
## Margin Protection: Revenue Is Vanity ##
Turnover growth is seductive.
It feels like progress.
But revenue alone tells you nothing about health.
Management accounts force examination of:
- Gross margin by service line.
- Contribution margin.
- Direct labour ratio.
- Fixed versus variable cost behaviour.
- Staff cost as a percentage of revenue.
- Overhead creep.
In the £1m–£5m bracket, margin erosion often happens quietly:
- Discounting to secure contracts.
- Wage inflation not passed through.
- Subcontractor costs rising.
- Additional admin hires.
- Software subscriptions accumulating.
- Premises upgrades.
Each individually justified.
Collectively damaging.
Without monthly variance analysis, erosion goes unnoticed until year-end confirms weaker profitability.
By then, pricing is embedded. Contracts are locked in.
- - -
## The Balance Sheet: Your Structural Report ##
Most owner-managers glance at profit and loss.
Few study the balance sheet properly.
That is a mistake.
The balance sheet tells you:
- Net asset position.
- Retained earnings.
- Liquidity.
- Leverage.
- Director loan status.
- Creditor reliance.
It answers uncomfortable questions:
Can we lawfully pay this dividend?
Are we solvent on paper and in practice?
Are we funding operations with tax arrears?
Is leverage increasing beyond comfort?
If retained earnings are thin, dividend headroom is thin.
Dividends may only be paid from realised profits.
If you take distributions unsupported by reserves, you expose yourself.
Management accounts allow real-time confirmation of distributable capacity.
That is protection, not bureaucracy.
- - -
## Director Loan Accounts: The Quiet Risk ##
In many SMEs, the director loan account becomes a pressure valve.
Cash is drawn ahead of formal dividend declarations.
Personal expenditure is run through the company.
Repayment is deferred.
Without monthly reconciliation, the director loan can drift into overdrawn territory.
An overdrawn director loan is not neutral.
It creates:
- Personal tax implications.
- Corporate tax charges.
- Potential reputational and legal exposure.
- Liquidity strain.
Management accounts track director loan balances in real time.
They prevent drift.
They force discipline between personal and corporate finances.
- - -
## Tax: The Accumulating Liability ##
Tax is rarely the dramatic cause of failure.
It accumulates.
VAT builds quarterly.
PAYE builds monthly.
Corporation Tax builds silently.
In growing businesses, Corporation Tax can increase sharply mid-year.
Without interim calculation, owners underestimate the liability.
Management accounts should:
- Estimate Corporation Tax on year-to-date profit.
- Accrue VAT accurately.
- Monitor PAYE exposure.
- Separate tax cash from operating cash in mindset.
Using tax as working capital is not a strategy.
It is a warning sign.
- - -
## Funding and Covenant Pressure ##
Many £2m–£5m businesses operate with overdrafts, invoice discounting, or term loans.
Facilities often contain conditions tied to:
- EBITDA.
- Interest cover.
- Leverage ratios.
- Net asset thresholds.
Without monthly monitoring, covenant pressure can develop unnoticed.
Management accounts provide early warning.
They allow corrective action before formal breach.
That preserves banking relationships.
- - -
## Decision-Making Requires Baselines ##
Hiring a £90,000 senior manager.
Signing a five-year lease.
Investing £500,000 in plant.
Reducing pricing to gain market share.
All require baseline understanding:
- Break-even levels.
- Cash headroom.
- Margin sensitivity.
- Working capital impact.
Management accounts allow scenario thinking.
Without them, instinct substitutes for analysis.
Instinct is valuable.
But instinct without numbers at £3m turnover is expensive.
- - -
## Cultural Shift: Visibility Changes Behaviour ##
Management accounts do something subtle.
They change how people behave.
When results are reviewed monthly:
- Spending becomes deliberate.
- Managers anticipate scrutiny.
- Pricing discipline improves.
- Problems surface earlier.
- Accountability strengthens.
Visibility reduces complacency.
It embeds financial literacy into leadership.
It professionalises the organisation.
- - -
## A Contrasting Example: The Disciplined Operator ##
Contrast Eastfield Projects with another client - let’s call them Northgate Solutions.
Turnover: £2.7m
Sector: Technical consultancy
Employees: 17
From £1m turnover onward, they implemented monthly management accounts.
They reviewed:
- Gross margin by project.
- Debtor ageing.
- Tax provisions.
- Director loan balances.
- Cash forecast three months ahead.
When debtor days moved from 48 to 62, they intervened immediately.
When margin on a new service line fell below target, pricing was corrected within one quarter.
When Corporation Tax provision rose mid-year, dividends were reduced accordingly.
They did not avoid volatility.
They avoided surprise.
When a major client reduced spend unexpectedly, they already knew:
- Break-even threshold.
- Cash runway.
- Variable cost levers.
- Hiring flexibility.
They responded calmly.
That calm was not personality.
It was preparation.
- - -
## Dashboards Are Not Management Accounts ##
Modern software produces attractive dashboards.
They are helpful.
But raw ledger feeds do not equal reconciled information.
True management accounts require:
- Accruals for known costs.
- Prepayments adjusted.
- Depreciation recognised.
- Tax provisions calculated.
- Control accounts reconciled.
- Narrative explanation provided.
Numbers without context mislead.
Data without interpretation is noise.
- - -
## Frequency and Timeliness ##
For most £1m–£5m businesses, monthly management accounts are appropriate.
Quarterly may suffice in low-volatility environments.
The key is timeliness.
Information must arrive early enough to change behaviour.
Late information confirms outcomes.
Timely information shapes them.
- - -
## Valuation and Exit Readiness ##
If you ever intend to sell, refinance, or bring in investment, buyers will request:
- Recent management accounts.
- Margin analysis.
- Cash conversion data.
- Working capital trends.
- Recurring revenue breakdown.
Strong internal reporting signals governance.
Weak reporting signals risk.
Risk reduces valuation.
- - -
## Foundation Thinking ##
This chapter sits early because management accounts represent a mindset shift.
They mark the transition from:
Founder-led intuition
to
System-led enterprise.
They reduce avoidable surprise.
They protect families from unnecessary stress.
They protect directors from avoidable exposure.
They strengthen culture.
They enhance valuation.
They improve sleep.
Eastfield Projects survived.
But the founder paid personally for delayed visibility.
Northgate Solutions slept better.
Not because business is easy.
But because they chose to operate with sight.
The question is not whether you can survive without management accounts.
Many do.
The question is:
Do you want to lead a £3m business on instinct?
Or do you want to lead it with clarity?
At this level, clarity is not a luxury.
It is leadership.
**About the author.**
Susie Kevern, FCMA, is a management accountant providing services to SMEs in the area of interpreting, evaluating, and planning financial performance of the business, and advising on strategic decisions to business owners, and management boards.
She graduated in Physics, and Meteorology, at the University of Reading, in 1999, and qualified as a Certified Management Accountant (CIMA) in 2004.
*She can be contacted via her website* [Poundlane Business Services] (https://poundlane.co.uk).
---
##Managing working capital.
In an earlier chapter we looked at how to calculate the
Working Capital of our business. While the Profit and Loss account tells us
whether a business is profitable, it doesn't tell us whether we can pay our
bills. Working capital is the lifeblood of any business operation.
Working capital is the difference between current assets and
current liabilities. In simple terms:
- **Current Assets**: Cash, receivables (money owed to us), inventory
- **Current Liabilities**: Payables (money we owe), short-term debts
**Formula:**
`Working Capital = Current Assets - Current Liabilities`
A profitable business can still fail if it runs out of cash. Understanding working capital helps managers answer critical questions:
- Can we pay our suppliers on time?
- Do we have enough cash to cover next month's wages?-
- Are we holding too much inventory?
### The Three Components
The cash conversion cycle measures how long it takes to
convert investments in inventory and receivables back into cash.
- Stock Days
- How long inventory sits before being sold
- Formula:
(Average Inventory / Cost of Sales) × 365
- Debtor Days
- How long it takes customers to pay us
- Formula:
(Average Receivables / Total Sales) × 365
- Creditor Days
- How long we take to pay suppliers
- Formula:
(Average Payables / Cost of Sales) × 365
**Cash Conversion Cycle** `= Stock days + Debtor Days – Creditor Days`
A shorter cycle means cash returns to the business faster.
###Working Capital Ratios - Your Yardstick Measures
Following the approach from the P&L analysis chapter, we can add some additional working capital components as percentages and ratios:
**Working Capital as % of Sales**
**Formula:** `(Working Capital / Total Sales) × 100`
- Track this percentage over time
- Rising percentage may indicate inefficiency
- Compare quarter-to-quarter like the P&L analysis
**Inventory Turnover Ratio**
**Formula:** `Cost of Sales / Average Inventory`
- Higher ratio = faster inventory movement
- Industry-dependent (grocery stores vs. car dealers)
### Practical Example: The Forecourt Business
Building on the petrol forecourt example from the P&L
chapter, let's add some details regarding its working capital:
| **Metric** | **Q1** | **Q2** | **Change** |
| ---- | ---- |---- | ---- |
| **Current Ratio** | 1.8 | 1.5 | -0.3 |
| **Quick Ratio** | 1.2 | 0.9 | -0.3 |
| **Working Capital** | £45,000 | £38,000 | -£7,000 |
| **WC as a % Sales** | 11% | 9% | -2% |
| **Stock Days** | 18 days | 22 days | +4 days |
| **Debtor Days** | 12 days | 15 days | +3 days |
| **Creditor Days** | 25 days | 28 days | +3 days |
| **Cash Conversion Cycle** | 5 days | 9 days | +4 days |
####What This Tells Us
1. **Liquidity is declining** - Both current and quick ratios have dropped
2. **Inventory is moving slower** - Stock sitting 4 days longer
3. **Customers paying slower** – Customers taking 3 extra days to pay
4. **We're delaying payments** - Taking advantage of supplier credit
5. **The cash cycle is lengthening** - Money tied up longer in operations
####Action Points to consider
- Review slow-moving inventory lines
- Tighten credit terms or follow up on overdue accounts
- Consider early payment discounts from suppliers if cash allows
## Summary
Working capital management isn't optional - it's essential. By tracking these ratios and metrics over time, just as we do with P&L percentages, managers gain a powerful "yardstick" for financial health. The key is consistency: measure regularly, compare over time, and act on what the numbers reveal.
Remember: **Profit is an opinion, but cash is a fact.**